
An analytics warehouse and a browser side dashboard over New York City taxi and for hire vehicle trip records. 92,208,701 trips are modelled into a tested star schema with dbt, every published metric is defined once in a version controlled metric layer, and a conformed mart layer is queried live in the browser by DuckDB-WASM over HTTP range requests.
Live dashboard · Results · Architecture · Data decisions · Metric layer · Statistics · Runbook
No key, no server, no setup. The demo is a static page.
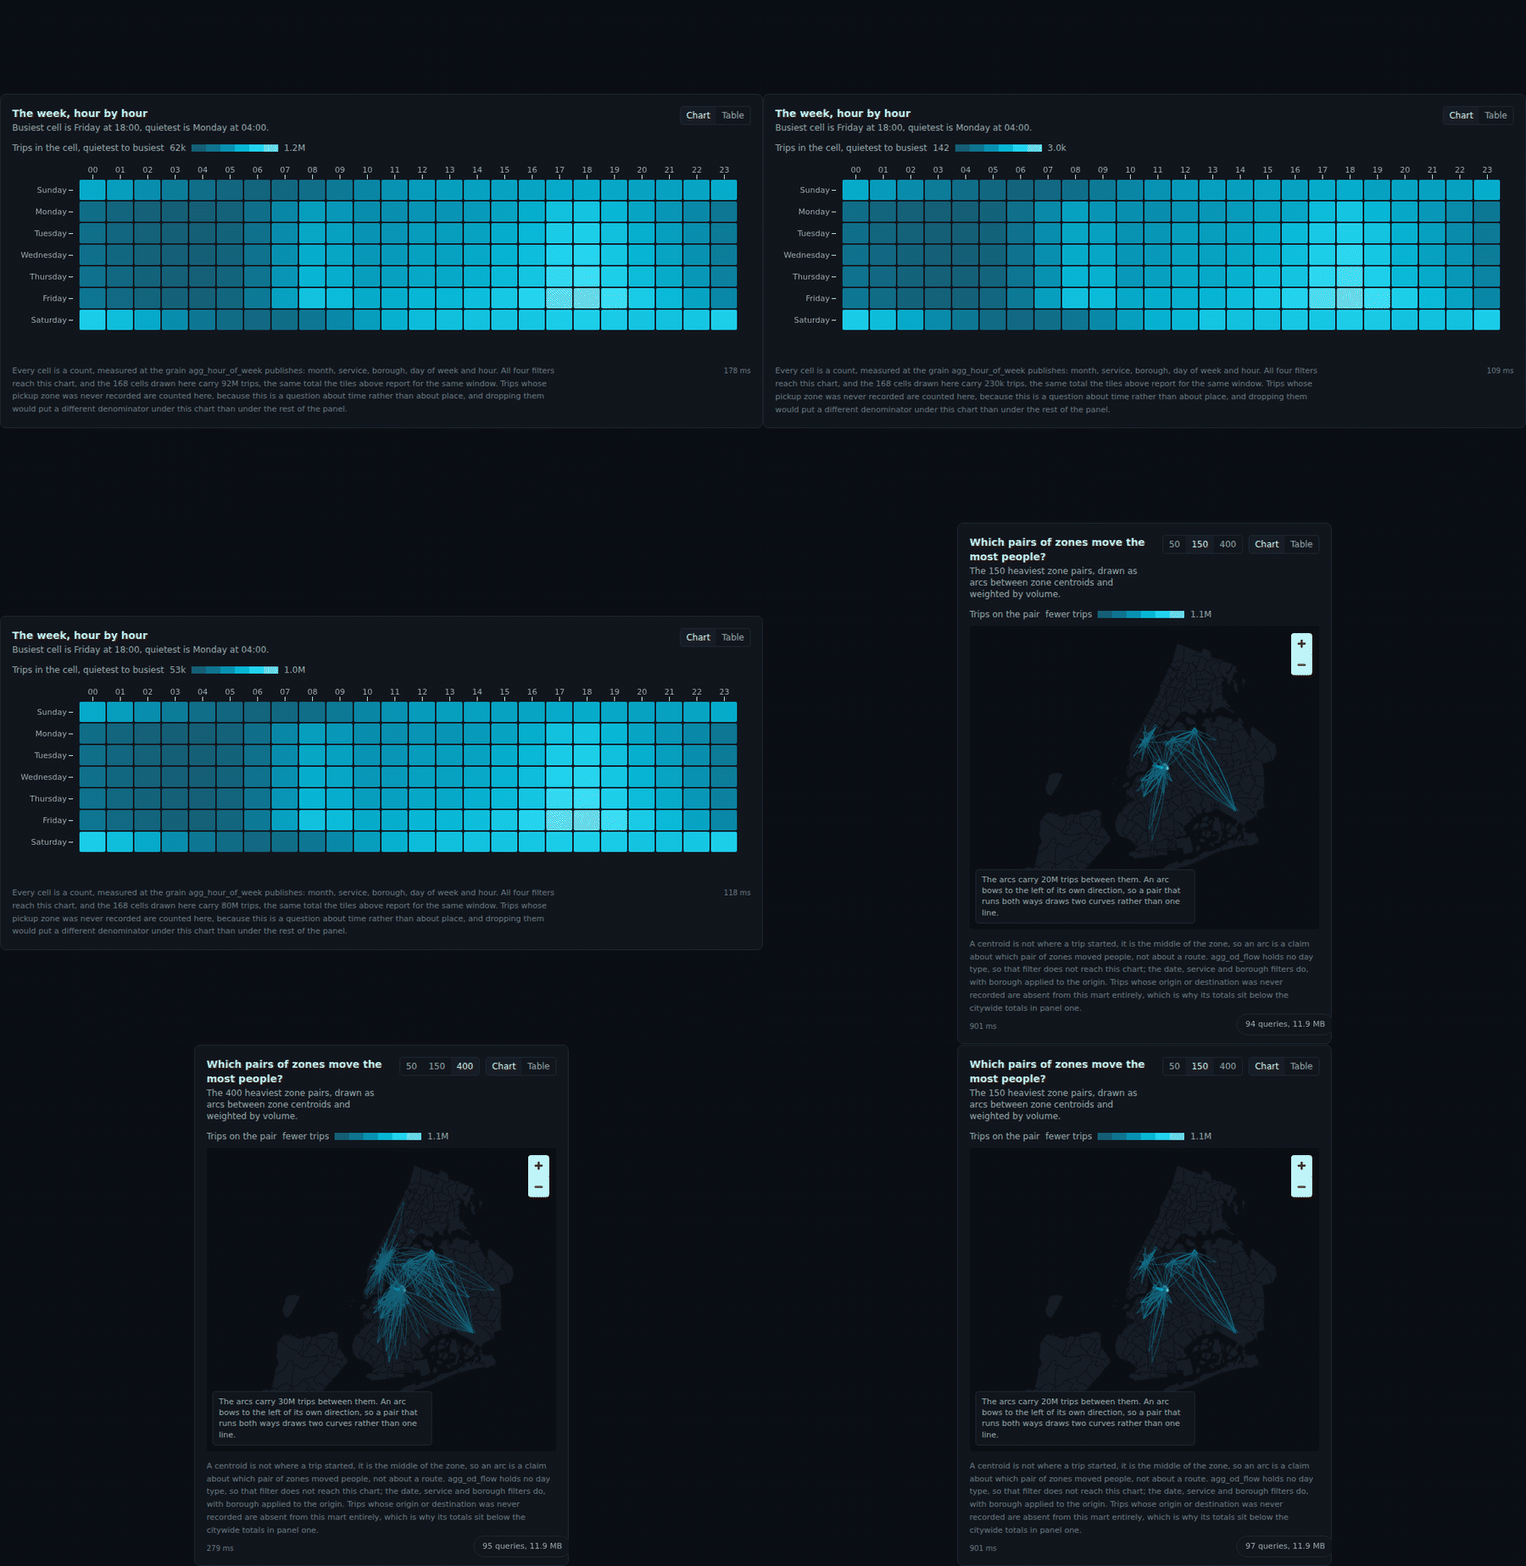
Every frame above is a query. The grid is 124,446 published rows read by HTTP range request, and each filter click runs SQL in the browser against parquet it never downloads whole.
The finding
Most published New York taxi tip rates are wrong, and the reason is one column.
Cash trips record a tip of zero. That is a missing value, not a zero: no tip passed through the meter, so the meter has nothing to record. Averaging tip over fare across all payment types therefore divides the tips that were observed by a population that includes 3,402,805 trips that could not have been.
Over the yellow and green trips in this warehouse:
| tip as a share of fare | |
|---|---|
| Averaged over every payment type | 14.15 percent |
| Card payments only, where a tip is observable | 20.35 percent |
The naive figure understates the real one by
43.9 percent of itself. tip_pct is modelled
as NULL wherever the payment channel cannot record a tip, never as zero, and
three dbt tests hold that line. For hire vehicle trips are settled in the app,
so their zeroes are real zeroes and they are included. The reasoning is in
docs/data.md.
Where the numbers come from
Read this before quoting any figure in this repository.
The pipeline has two ingest backends behind one interface, and they take the same path through the vintage mapping, the normalizer, the quarantine rules and the warehouse.
tlcreads the published TLC parquet over HTTPS. It is whatmake ingest-tlcruns.syntheticruns a seeded generator that reproduces the TLC schema and its defects: per vintage column drift, cash trips recording a tip of zero, timestamps outside the file's own month, unknown zones 264 and 265, negative durations, exact duplicates, and surcharge columns null before the month they were introduced.
Every figure in this repository was measured on the synthetic backend.
The generator exists because this repository was built on a machine whose egress
policy denies the TLC distribution host, because continuous integration cannot
download eight gigabytes on every push, and because every quarantine rule needs
a fixture that actually contains the defect it claims to catch at a realistic
rate and scale.
What the generator reproduces is the schema and the defects. What it does not reproduce is real trip volumes, real fares, or any finding about New York City. The tip rate gap above is a property of how payment channels record tips, which the generator models deliberately; it is not a measurement of New York. The zone geometry, the zone names and the boroughs are the real TLC shapefile.
Run make ingest-tlc and then make pipeline, and every figure in every
document in this repository is re-derived from the real files by the claim gate.
Nothing here is typed by hand.
What it does
  SOURCE
  TLC trip record parquet, yellow + green + for hire, or the seeded generator
        |  ingest        per vintage schema mapping, quarantine, one month at a time
        v
  warehouse.duckdb  (local, gitignored, 92,208,701.0 rows at trip grain)
        |  dbt staging   typing, derivation, the quarantine marts
        |  dbt marts     star schema, fct_trip incremental by month
        v
  +--------------------------------------------------------------+
  |  fct_trip                 the grain, 92,208,701 rows |
  |  dim_zone  dim_date  dim_hour  dim_service  dim_ratecode      |
  +---------------------------+----------------------------------+
                              |  publish
                              v
  +--------------------------------------------------------------+
  |  SHIPPED LAYER, what the browser can reach                    |
  |  23 files, 67.4 MB total,    |
  |  largest 31.8 MB                        |
  |  additive components only, never a rate                       |
  +---------------------------+----------------------------------+
                              |  HTTP range requests
                              v
  +--------------------------------------------------------------+
  |  BROWSER: DuckDB-WASM in a worker                             |
  |  every filter is a real SQL query                             |
  +--------------------------------------------------------------+
92,208,701 rows at trip grain are summarized into 67.4 MB that the browser queries, which is 1,368,518 source rows for every megabyte shipped. The detail lives in the warehouse and the browser queries conformed aggregates. That is not a workaround for a static host, it is how BI works, and ARCHITECTURE.md says why at length because it is the question this design gets asked.
Six panels, each headed by the question it answers rather than its topic:
- What does a normal week look like, and when did that change?
- Where do trips start and end, and how concentrated is that?
- How do trips differ by hour, and what does that cost the rider?
- How have yellow, green and for hire vehicles traded share?
- Can you trust these numbers?
- Where does each number come from?
The parts worth looking at
The metric layer. 16 metrics, each defined once in
metrics/metrics.yml, each carrying two expressions: one
over fct_trip and one over the additive components of the shipped aggregates.
cityflow reconcile runs both across four grains and fails the build when they
disagree. A metric layer that cannot prove the shipped copy agrees with the
warehouse is a document about the code rather than a constraint on it. A second
gate scans the dashboard source and fails if it computes a metric the layer
already defines.
The quarantine. 425,876 rows,
0.4597 percent of source, caught by
9 named rules. Nothing is deleted. Every rejected
row is logged with the rule that caught it, the counts are on the dashboard, and
the identity source rows = clean rows + sum(quarantine counts) is asserted
after every month. A pipeline that cannot say where its rejected rows went does
not get to call itself clean.
Unknown zones. Zone ids 264 and 265 mean the TLC could not determine the location. They carry 1,574,148 trips, 1.71 percent of the total. They are kept, flagged, and excluded from geographic aggregates only, with the exclusion and its share stated on the map. Dropping them is the easy version and it biases every total.
The statistics. Wilson intervals on every proportion, not the normal approximation. STL with gap detection. PELT changepoints written out rather than imported. And 757 zone comparisons corrected with Benjamini-Hochberg: 25 of them look significant at an uncorrected five percent threshold, which is what you would expect from 38 by chance alone, and 0 survive the correction. The panel states the comparison count on screen.
The schema change. The window spans the month the airport fee column appears
in the published files. mart_null_rates shows
54 service months where the column is entirely
null, then January 2022, where it starts carrying
values. A column that does not exist yet is modelled as NULL and never as zero,
so the series shows a gap rather than a step up from nothing.
The gates. Every one of these fails the build.
| gate | what it refuses |
|---|---|
make claims |
a figure in any document that the warehouse does not produce |
make reconcile |
the shipped aggregates disagreeing with the warehouse |
make metric-gate |
the dashboard computing a metric the layer defines |
make size |
a shipped file past 95 MB |
make palette |
a colour scale that fails contrast, separation or colour vision deficiency checks |
make lint |
an em dash, a type error, a lint error, unformatted SQL |
make test |
a failing test, or coverage below 80 percent |
Each gate has a test that breaks something on purpose. A gate whose only test asserts that the current tree passes is not a gate, which is a lesson from the previous build in this series where two wrong figures sat in a document while four such tests passed.
Running it
make install        # uv sync, npm ci
make doctor         # what this machine can and cannot do
make pipeline       # zones, ingest, dbt, publish, reconcile, docs
make gates          # every gate
make web            # the static dashboard export
Against the real TLC files:
make ingest-tlc && make transform publish reconcile docs
The claim gate re-derives every figure in every document from the rebuilt warehouse, so a number that moves shows up as a diff rather than as a surprise. docs/runbook.md covers the failure modes that actually happen.
Stack
DuckDB as the engine, everywhere: the pipeline, the warehouse, and the browser. dbt-core with dbt-duckdb for the modelling, 14 models and 150 data tests. Python 3.12 in a uv workspace, ruff and mypy strict. scipy and statsmodels underneath a typed statistics package. Next.js static export with TypeScript strict and Tailwind, Observable Plot for the grammar of graphics work, MapLibre for the geography, and one hand built D3 layered graph for the lineage panel. DuckDB-WASM in a web worker, reading parquet by HTTP range request from a static host.
Layout
packages/core      configuration, schemas, the DuckDB session factory
packages/ingest    source registry, per vintage mapping, quarantine, generator
packages/stats     Wilson, STL, PELT, Benjamini-Hochberg, each independently tested
packages/publish   aggregate builders, the metric layer, reconcile, the manifest
transform/         the dbt project: staging, marts, tests, exposures
metrics/           metrics.yml, the single definition of every published number
scripts/           the gates, the palette validator, the query benchmark
web/               the dashboard and its shipped data
docs/templates/    every document, rendered from the manifest and never edited
Documents are rendered, not written. docs/templates/README.md is the source of
this file; editing README.md directly makes make claims fail with a diff.
Licence
Apache 2.0.