🛰️ Orbis Monitoring
Know when your websites go down, before your clients do.
Uptime and response time monitoring built into your Orbis environment. Every site you manage, checked every minute, right inside WordPress.
Features · How it works · Installation · Developers · Contributing
Why Orbis Monitoring?
You already keep your clients, projects and subscriptions in Orbis. Why keep your uptime monitoring in yet another SaaS dashboard?
Orbis Monitoring turns any URL into a monitor, a regular WordPress post that lives next to the rest of your work. Every minute it checks whether the site responds the way it should. If something is off, your team hears about it in Slack right away.
No external service. No monthly fee per monitor. Your data stays on your own server.
✨ Features
| ⏱️ Checked every minute | Each published monitor is checked every 60 seconds, reliably queued through Action Scheduler instead of flaky WP-Cron. |
| 🎯 More than "is it online?" | Set the status code you expect (200, 301, 410, …) and, for redirects, the exact Location it should point to. A wrong redirect counts as a problem too. |
| 🔔 Slack alerts without the noise | A URL is only considered offline after a number of failed checks in a row (default 3). You get one message when it goes offline and one when it is back online, with the duration of the outage. Reminders while it stays offline are optional. |
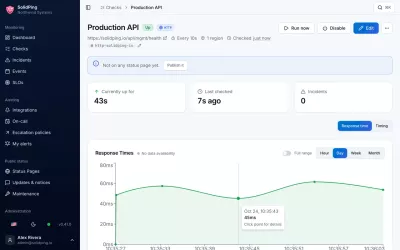
| 📈 Response time graphs | See how fast a site responded over the past year, grouped per day, week or month, with Chart.js. |
| 🗂️ Full history | Every check is stored: duration, status code, message, content type and content length. Spot trends, prove SLAs, find out when it started. |
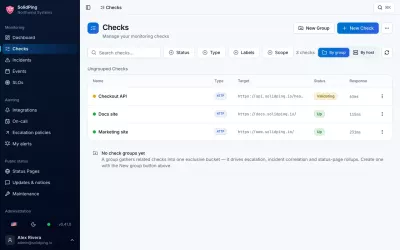
| 📋 Overview at a glance | See the status (online, pending or offline) of all monitored URLs in one list, together with the last response code, response time and check time. |
| 🚨 Incident history | Every outage is stored as an incident, with start, end, duration and the error. Open a monitor to see its incidents, including the one that is still ongoing. |
| 🌐 Front-end pages | A /monitors/ archive and detail pages fit right into the Orbis theme, so your whole team can see the status and incident history. |
| 🔌 REST API ready | Monitors are available via the WordPress REST API at /wp-json/wp/v2/orbis/monitors. |
| 🧩 Hooks | Plug in your own notifications, tickets or dashboards with the orbis_monitoring_incident_opened, orbis_monitoring_incident_resolved and other actions. |
| 🇳🇱 Translated | Ships with Dutch translations, ready for more. |
🔄 How it works
flowchart LR
    A[⏱️ Every minute] --> B[Queue a check<br/>per monitor]
    B --> C[🌐 Request URL]
    C --> D[(💾 Store response<br/>& timing)]
    D --> E{Expected status<br/>and location?}
    E -- ✅ yes --> F{Was it offline?}
    F -- yes --> G[orbis_monitoring_incident_resolved]
    E -- ❌ no --> H{Failed checks in a row<br/>reached threshold?}
    H -- no --> I[🟠 Pending]
    H -- yes, first time --> J[orbis_monitoring_incident_opened]
    G --> K[🔔 Slack alert]
    J --> K
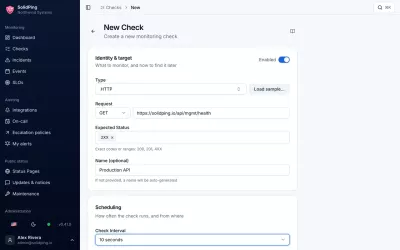
- Add a monitor: give it a title and a URL, and optionally the status code and redirect location you expect.
- Sit back: Action Scheduler queues one check per monitor every minute. Checks are unique per monitor, so a slow site never piles up a backlog.
- Get notified: when the response doesn't match a number of times in a row, an incident is opened, the
orbis_monitoring_incident_openedaction fires and your team gets one Slack message. When it recovers, the incident is resolved andorbis_monitoring_incident_resolvedfires. The threshold and an optional reminder interval are set under Settings → Orbis Monitoring. - Dig in: open the monitor to see its status, incident history, response history and response time graph.
Tip
Redirects are not followed. That's on purpose: it lets you check that
http://sends visitors tohttps://, or that an old domain still redirects to the right place.
📦 Installation
Requirements: WordPress 7.1+, PHP 8.3+ and an Orbis environment.
- Download the latest release, or build it yourself (see Development).
- Upload the
orbis-monitoringfolder towp-content/plugins/. - Activate Orbis Monitoring in WordPress.
- Go to Monitors → Add New and add your first site. 🎉
Server cron
By default Action Scheduler runs its queue on WP-Cron, which only fires when someone visits the site. For checks that really run every minute, let the server run the queue with WP-CLI. All actions of this plugin are in the orbis-monitoring group, so you can run just those:
* * * * * wp action-scheduler run --group=orbis-monitoring --batch-size=500 --batches=1 --path=/path/to/wordpress --quiet
--group=orbis-monitoringonly runs the actions of Orbis Monitoring, so other plugins can't slow down the checks.--batch-size=500 --batches=1runs up to 500 actions per minute. Each published monitor adds one check per minute, so keep the batch size above the number of monitors.--quietkeeps the output out of your cron mail. Errors are still sent.
Each published monitor adds an action every minute, so Orbis Monitoring tunes Action Scheduler for a high volume of actions:
| Setting | Default | Orbis Monitoring |
|---|---|---|
Batch size (action_scheduler_queue_runner_batch_size) |
25 | at least 100 |
Concurrent batches (action_scheduler_queue_runner_concurrent_batches) |
1 | at least 3 |
Retention period of completed actions (action_scheduler_retention_period) |
30 days | at most 3 days |
With only one concurrent batch, the server cron fails with Error: There are too many concurrent batches. whenever WP-Cron or another plugin is already processing its queue.
Tip
Also run the queue of other plugins with a separate cron line without
--group, or keep WP-Cron enabled for them.
Slack alerts
Install the Slack plugin and add an integration. Orbis Monitoring adds three events you can choose from:
- When a monitor detects an outage: once, when the monitored URL goes offline.
- When a monitor detects that an outage continues (reminder): only when a reminder interval is set.
- When a monitor detects a recovery: once, when the monitored URL is back online, with the duration of the outage.
Note
Earlier versions had Slack events that fired for every check. These events are removed, so select the new events in your Slack integration after updating.
🧩 For developers
Orbis Monitoring is built to be extended. Hook into the checks to send alerts anywhere you like:
add_action(
	'orbis_monitoring_incident_opened',
	function ( WP_Post $post, array|WP_Error $response, object $incident ): void {
		$url = get_post_meta( $post->ID, '_orbis_monitor_url', true );

		// Create a ticket, send an SMS, page the on-call engineer…
	},
	10,
	3
);
| Hook | When | Arguments |
|---|---|---|
orbis_monitoring_incident_opened |
An incident is opened: the threshold of failed checks in a row is reached | $post, $response, $incident |
orbis_monitoring_incident_reminder |
An incident is still open and the reminder interval has passed | $post, $response, $incident |
orbis_monitoring_incident_resolved |
An incident is resolved: a check succeeds again | $post, $incident |
orbis_monitor_problem |
Every check where the response code or Location header doesn't match |
$post, $response, $message |
orbis_monitor_checked |
After every check | $post, $response |
Want a different look? Add an archive-orbis_monitor.php to your theme and it is used instead of the template in this plugin.
🧰 Development
composer install
npm install
Local environment (wp-env)
npx wp-env start
npx wp-env stop
The .wp-env.json maps the plugin twice into the WordPress environment:
| Mount path | Source | Purpose |
|---|---|---|
wp-content/plugins/orbis-monitoring-dev |
./ |
Live development (including dev files) |
wp-content/plugins/orbis-monitoring |
./build/orbis-monitoring/ |
Built distribution version |
Run composer run build to create the build version.
Useful commands
| Command | Description |
|---|---|
composer run build |
Build the distribution version and ZIP archive |
composer run qa |
Run the code quality checks (PHPCS) |
composer run make-pot |
Update the translation catalogs |
Housekeeping
Monitoring every minute adds up: with 350 monitors that is over 500,000 responses a day. Orbis Monitoring keeps the database lean with two Action Scheduler jobs in the orbis-monitoring group:
| Action | Interval | Description |
|---|---|---|
orbis_monitoring_aggregate_responses |
Hourly | Summarizes the responses per monitor per hour in the orbis_monitor_response_stats table (number of checks, total, minimum and maximum duration). The response time graph uses these summaries. |
orbis_monitoring_cleanup_responses |
Daily | Deletes responses older than the response retention period, only when they are summarized. |
The response retention period defaults to 30 days and can be changed under Settings → Orbis Monitoring → Data. The hourly summaries are kept indefinitely.
The summaries can also be managed with WP-CLI:
| Command | Description |
|---|---|
wp orbis-monitoring aggregate-responses |
Summarize all responses that are not summarized yet, without the 31 day limit of the scheduled action. |
wp orbis-monitoring aggregate-responses --rebuild |
Delete the summaries for the period that still has responses and summarize these responses again. |
wp orbis-monitoring aggregate-responses --from=2026-10-01 --to=2026-10-08 |
Summarize the responses in a period again. |
wp orbis-monitoring verify-responses [--all] |
Compare the number of responses with the summaries per day. |
📄 License
Orbis Monitoring is free software, licensed under the GPL-2.0-or-later.
Made with ❤️ by Pronamic