A local-first desktop IDE to run, test and debug the code your AI agent writes.
Routes, API client, Delve debugger, database and brokers in one window. No account, no cloud, no telemetry.










Listed in awesome-wails and awesome-api-clients.
Download for Windows (.exe) · Download for macOS (.dmg) · Download for Linux (.tar.gz)
Watch the demo · Getting started · Guida in italiano
English · Español · 日本語 · 简体中文
Star the repository and choose Watch → Releases to follow progress.
The problem
AI agents now write a large share of backend code. Checking it is the slow part: start the service, find the port, open an API client, attach a debugger, inspect the database. Each step lives in a different tool, and none of them knows about the others.
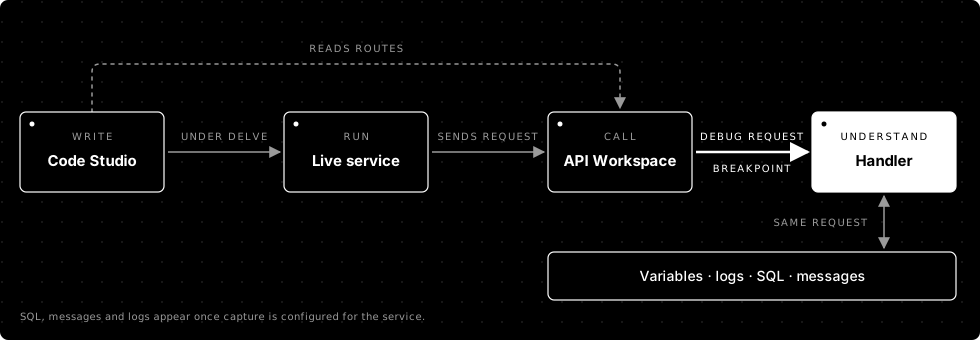
adOmnia puts that loop in one window. It reads your routes from the code, so the API client and the debugger already know which service and handler a request belongs to.
Try it in 2 minutes
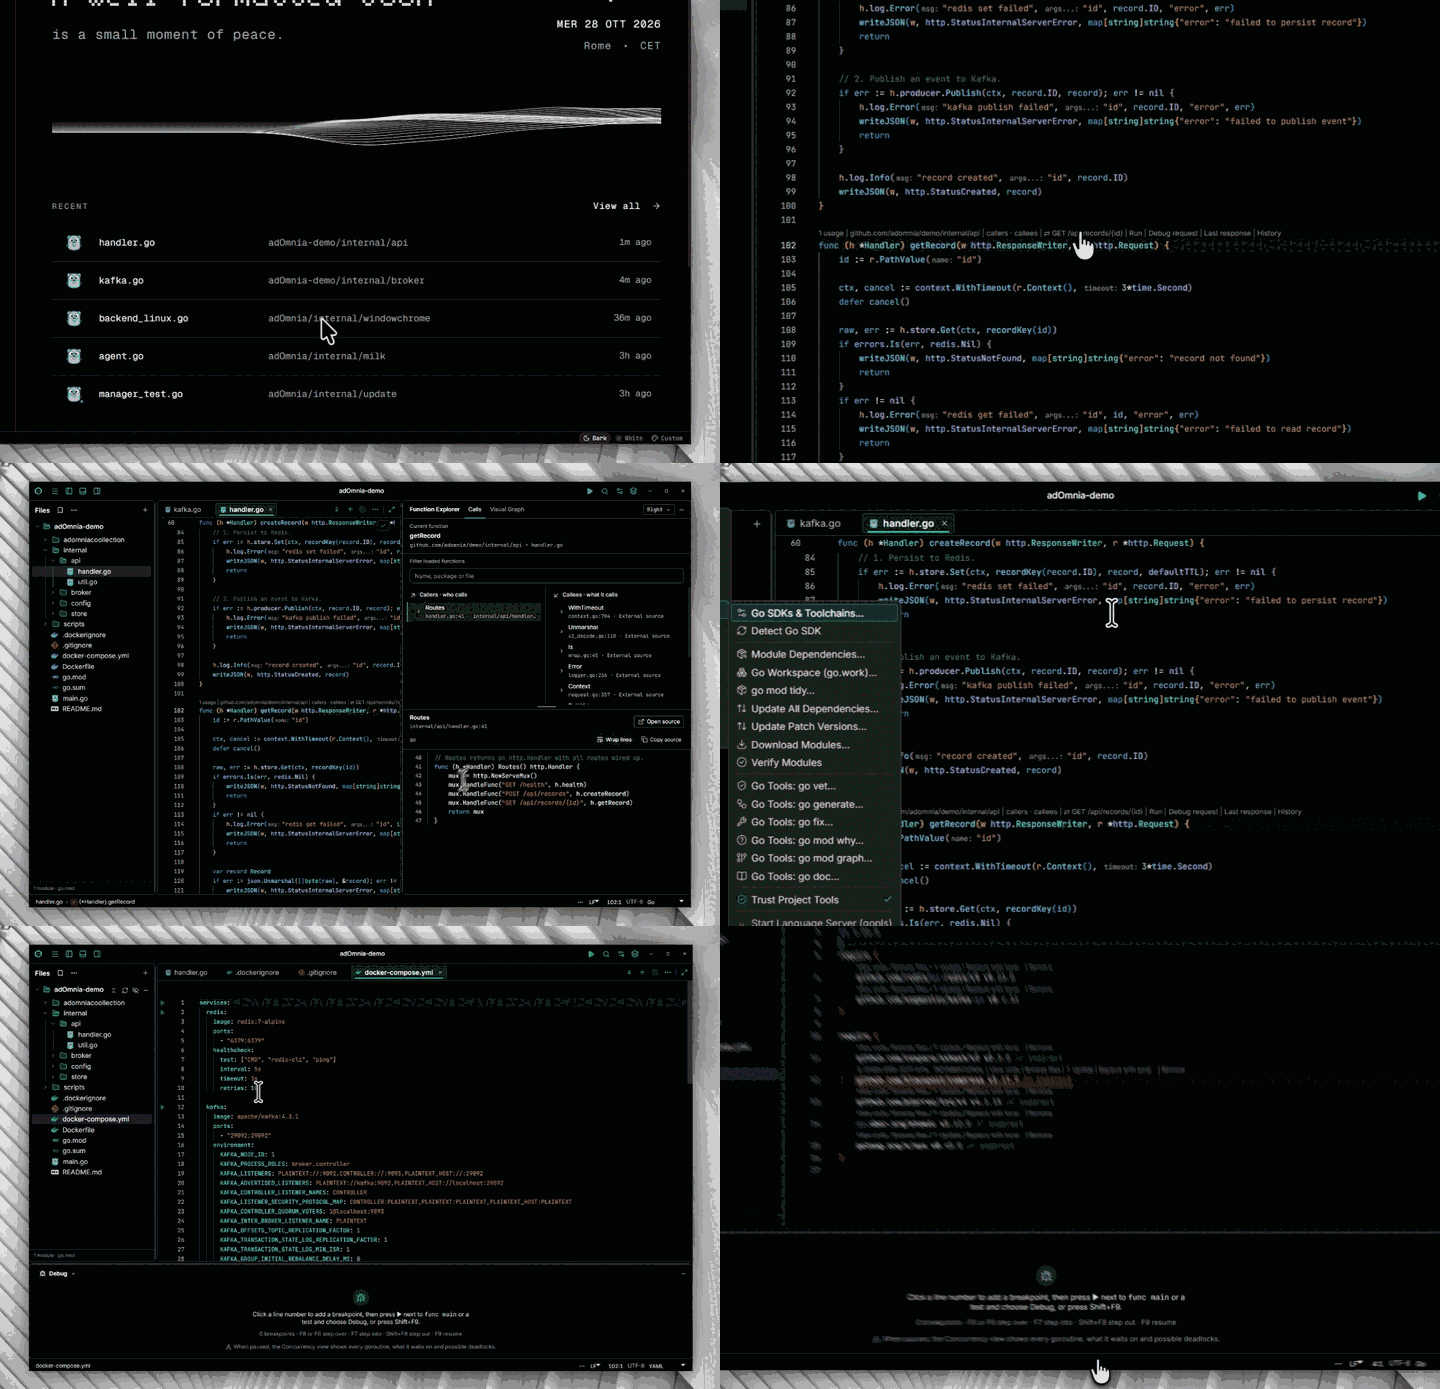
- Download and open it. See Download and install for the SmartScreen / Gatekeeper prompt on first launch.
- In Code Studio, choose File → Open Project and pick a Go service. Trust the folder when asked.
- Press
Ctrl+Kand search for one of your routes. - Choose Debug Request and set a breakpoint in the handler.
- The service starts under Delve, the request is sent, and execution stops on your breakpoint.
A step-by-step version is in Getting started.
What you get
- Endpoints discovered from the code. Opening a project builds a local map of modules, services, datasources,
.envvariables, OpenAPI/proto/WSDL contracts and HTTP routes (net/http, gin, echo, chi, gorilla; Spring MVC; FastAPI, Flask, Django).Ctrl+Kjumps to a route, table, topic or service and acts on it: send it, open its handler, mock it, query it. - Request-level debugging. Debug Request starts your service under Delve, waits for the port, sends the request and stops on the breakpoint that handles it. Requests can target a service by name, resolved to your local run, a Compose port or a remote URL, and show the SQL and Kafka traffic they cause.
- A full IDE for Go, Java and the web. gopls completion, diagnostics and refactoring; run, test and debug from the gutter; pprof and escape-analysis workbenches; a Git workbench with hunk staging; several isolated projects open at once. Java/Spring, TypeScript/JavaScript and Python follow the same run, test and debug interface.
- Data and messaging beside the request. Database Studio (PostgreSQL, MySQL/MariaDB, MongoDB, Redis), Broker Studio, Docker Lab, Mock Server, Proxy, Browser Debugging, load testing and WebSocket/SSE/gRPC/SOAP clients. Opening a tool from a detected service arrives already configured.
- Enterprise protocols. SOAP/WSDL, WS-Security, mTLS, JKS and certificate tools sit in the same workspace as modern HTTP APIs.
- Dependency security. Security Center scans
pom.xml,go.modand Python manifests, separates severity from exploitation signals, and previews the impact of an upgrade. Fixes show the diff and apply only after review. - Local-first and extensible. No cloud, no account, no telemetry. Project tools run only after you trust a project, and every tool install shows its exact command first. Light and dark themes, importable skins, a JavaScript plugin system, shareable templates and Git-friendly workspaces. One portable executable.
Tour of adOmnia
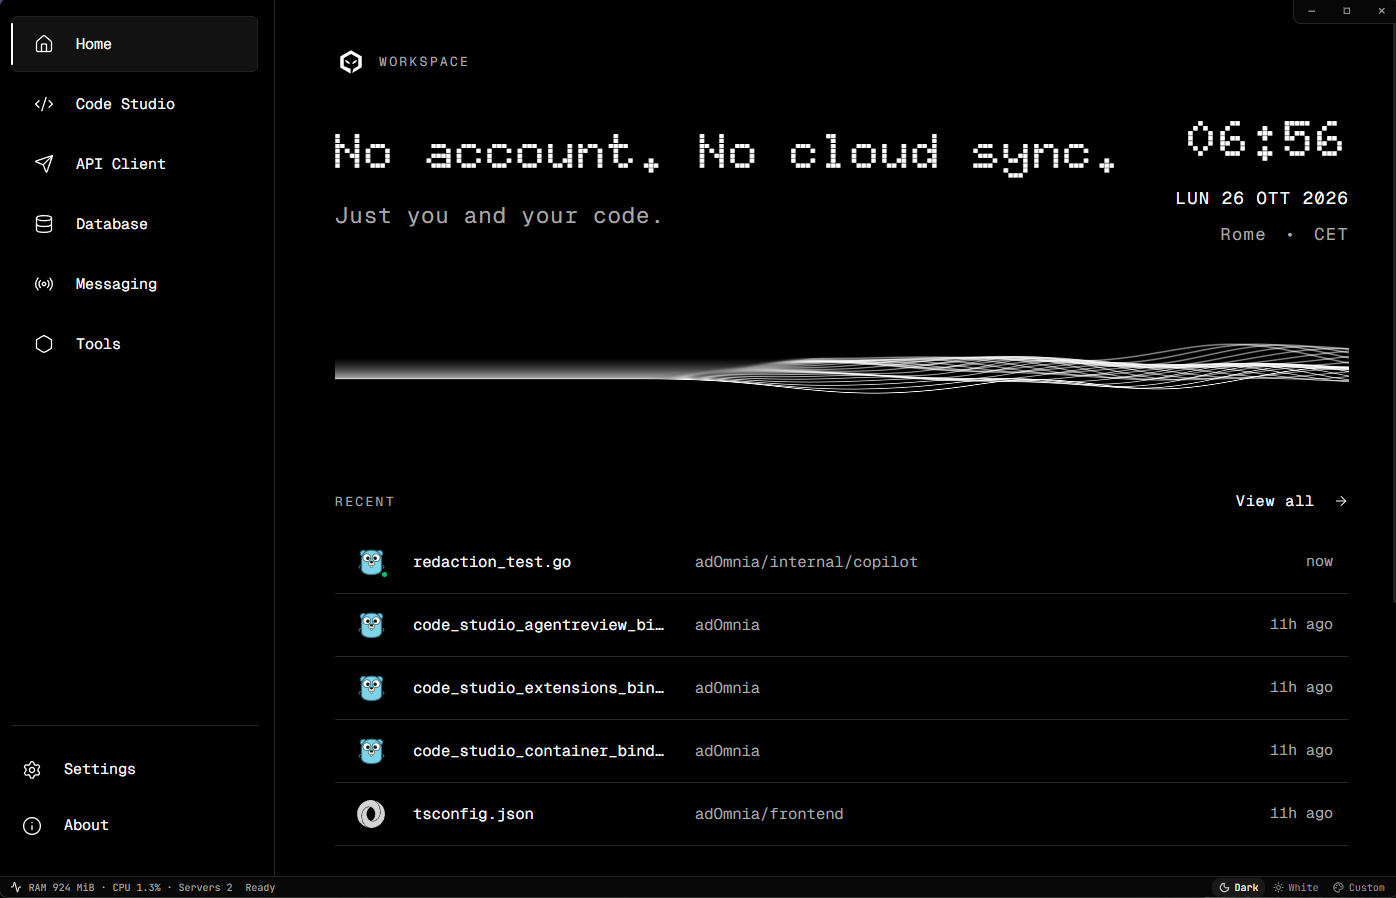
Workspace Hub
Start here. A time-of-day greeting and a dot-matrix clock sit above Continue coding, which reopens your last file together with its project. The recent list keeps the files you worked on most recently, and the sidebar opens Code Studio, the API Client, Database, Messaging, Tools, Settings and About.
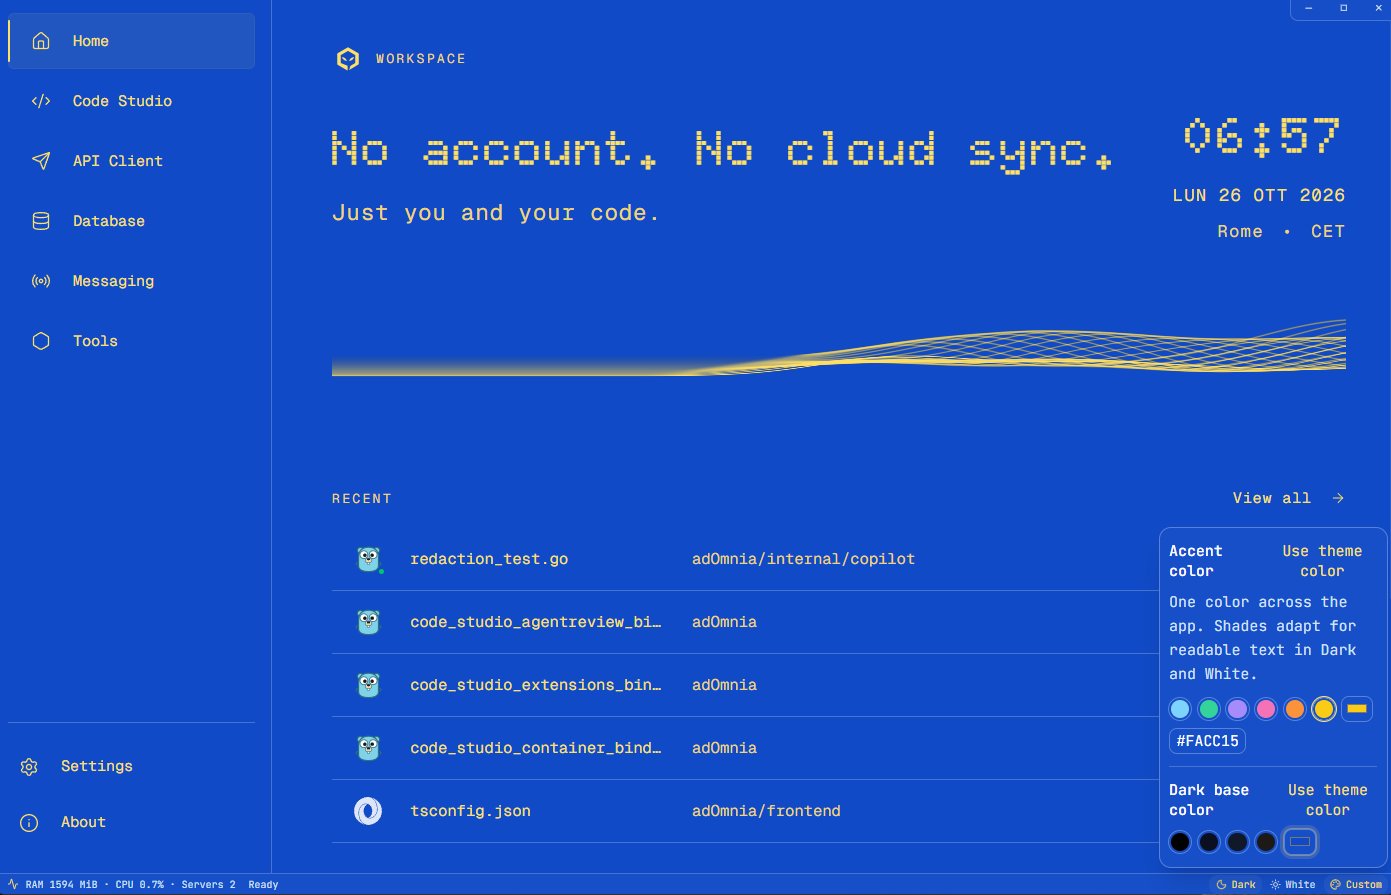
Custom Hub: your own colors
Pick one accent color and a dark base from Settings → Appearance, or start from a preset (Anthracite, Black/White, White/Black). The whole app follows, from the rail to the hub and every studio. Shades adapt so text stays readable in Dark and White.
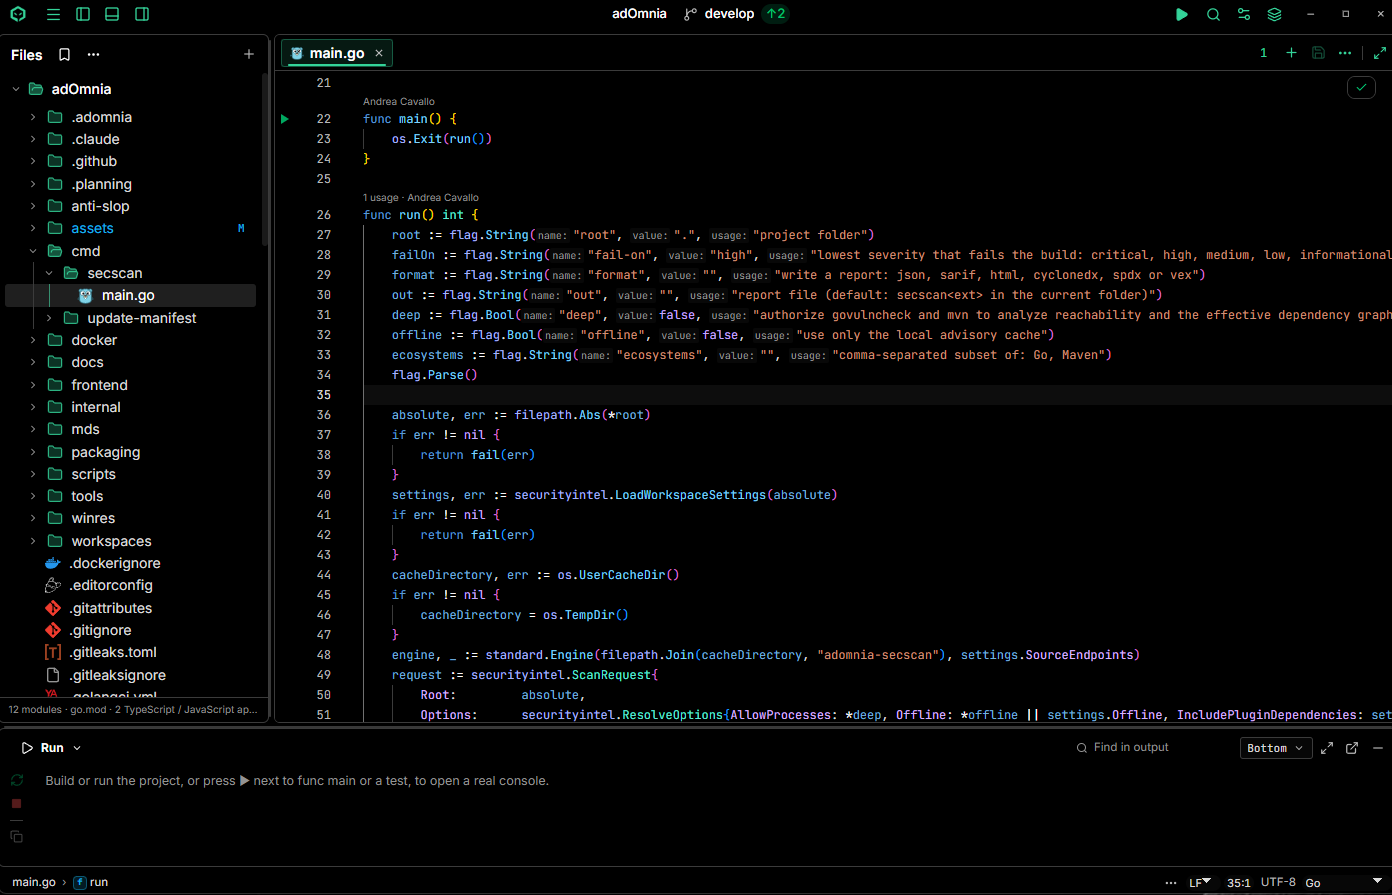
Code Studio with Go
Project tree with Git markers and hover actions, gopls completion and usage counts, Build/Test/Vet lenses, run configurations with running/starting/retry states, and a compact chrome: project and branch centered in the top bar, a searchable list of open files beside the tabs, collapsible tool windows, and the file name with its enclosing symbols in the status bar, next to line:column and the Go SDK.
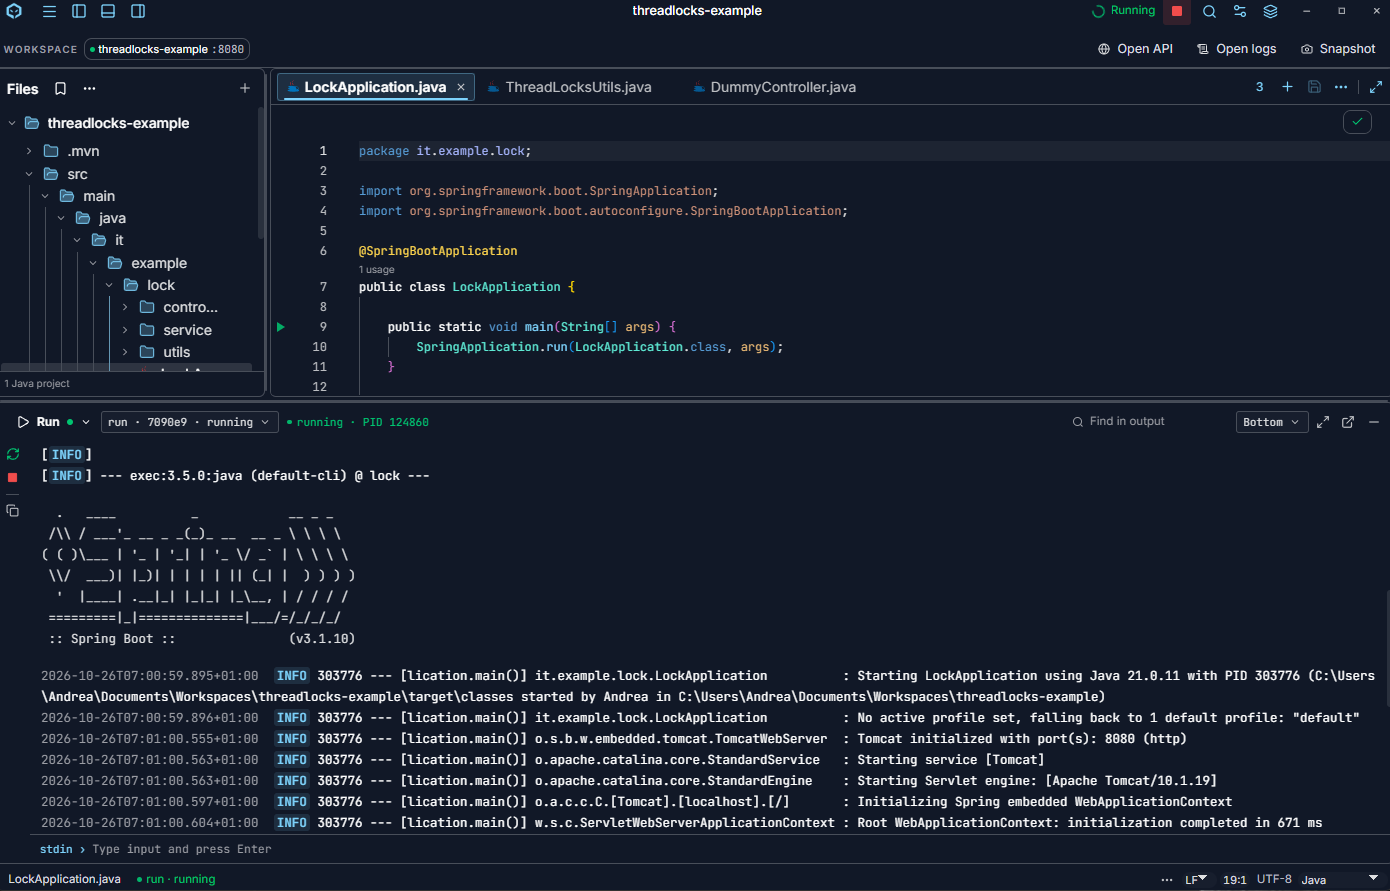
Code Studio with Java
Same IDE, another language: a Maven/Spring project with Eclipse JDT LS, Javadoc and the same run, test and debug interface.
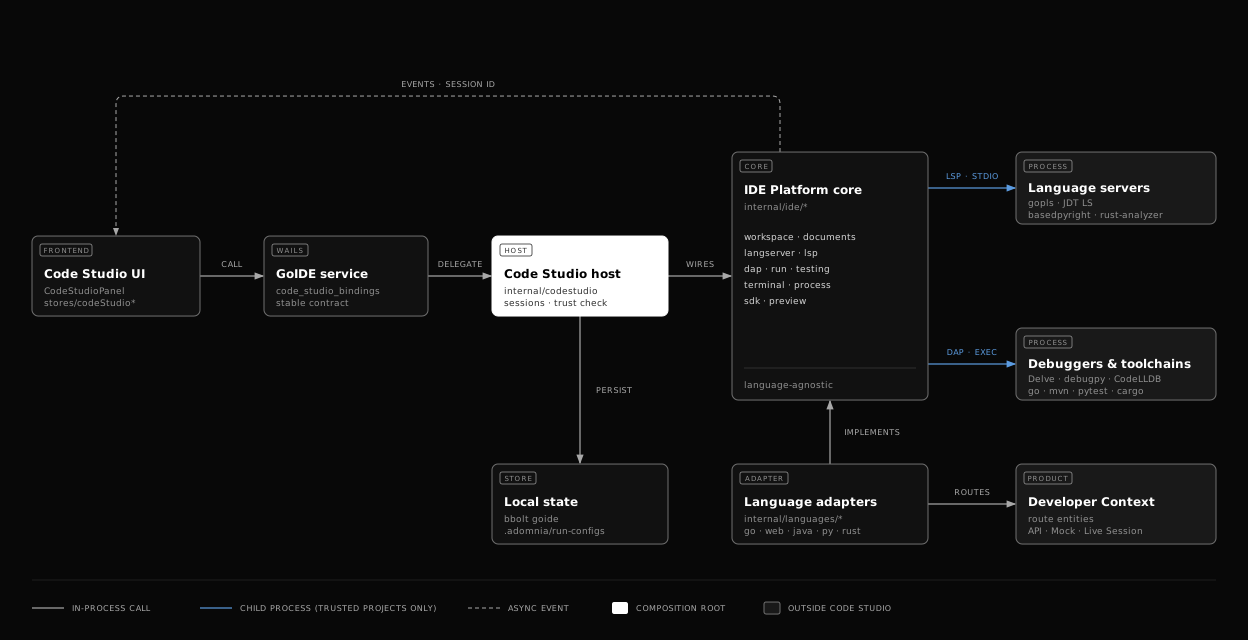
How Code Studio is built
The UI calls one stable Wails service (GoIDE). The host in internal/codestudio keeps the sessions and the trust check and wires a language-agnostic IDE core (internal/ide/*). Each language plugs into that core as an adapter (internal/languages/*) and publishes its routes to Developer Context, so API Workspace, Mock and Live Session see them. Language servers, debuggers and toolchains start as child processes only for trusted projects, and events come back to the UI by session. Details: Code Studio technical reference.
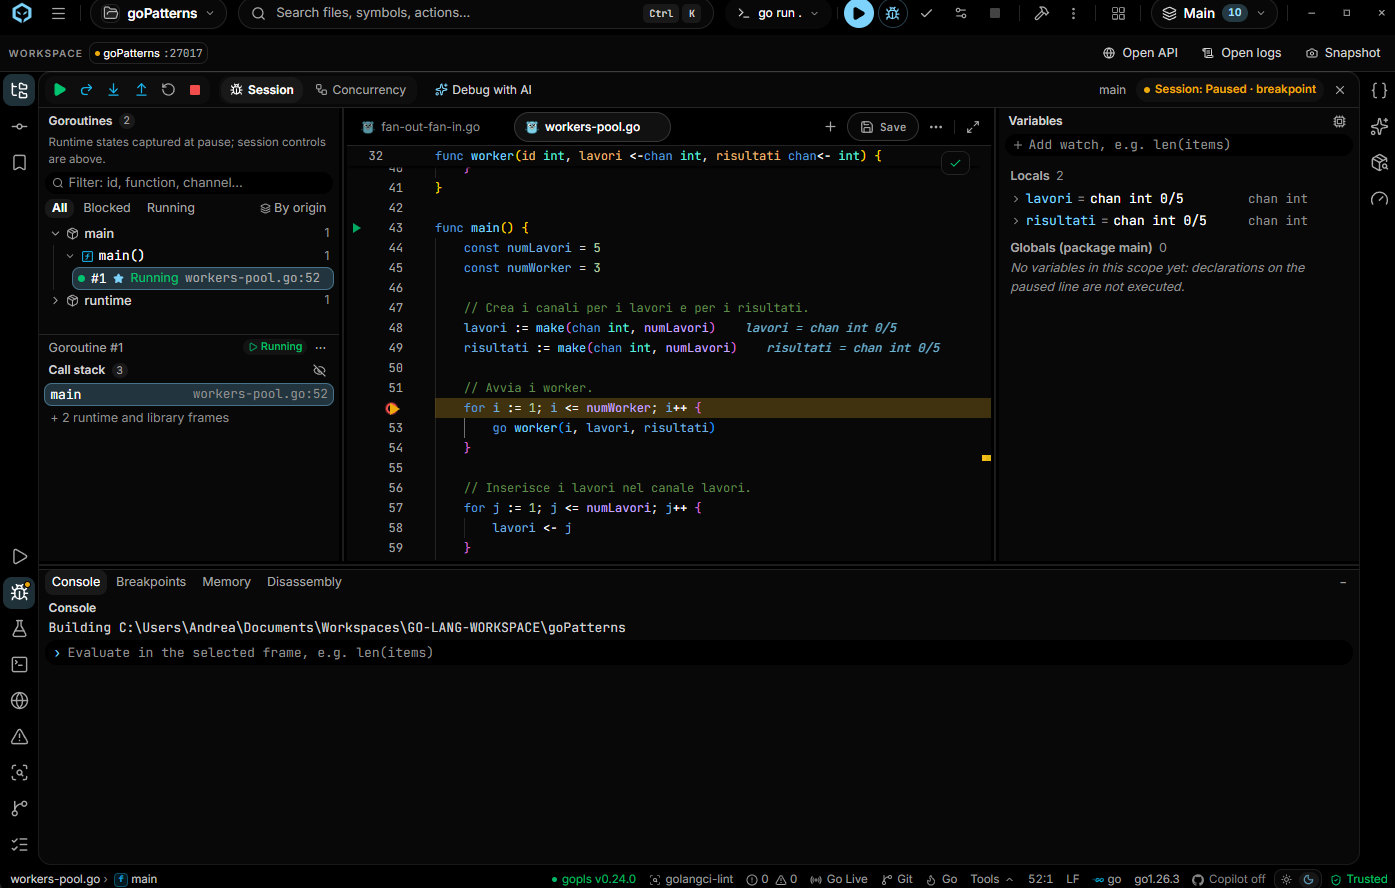
Debugger
Stop on a breakpoint and inspect goroutines, call stack, locals and globals, with inline values in the editor, breakpoints, memory, disassembly and an evaluate console.
AI Assistant
Ask Copilot, milk, Claude Code or OpenCode without leaving the editor. The assistant sees your project rules and the open file, and answers beside the code.
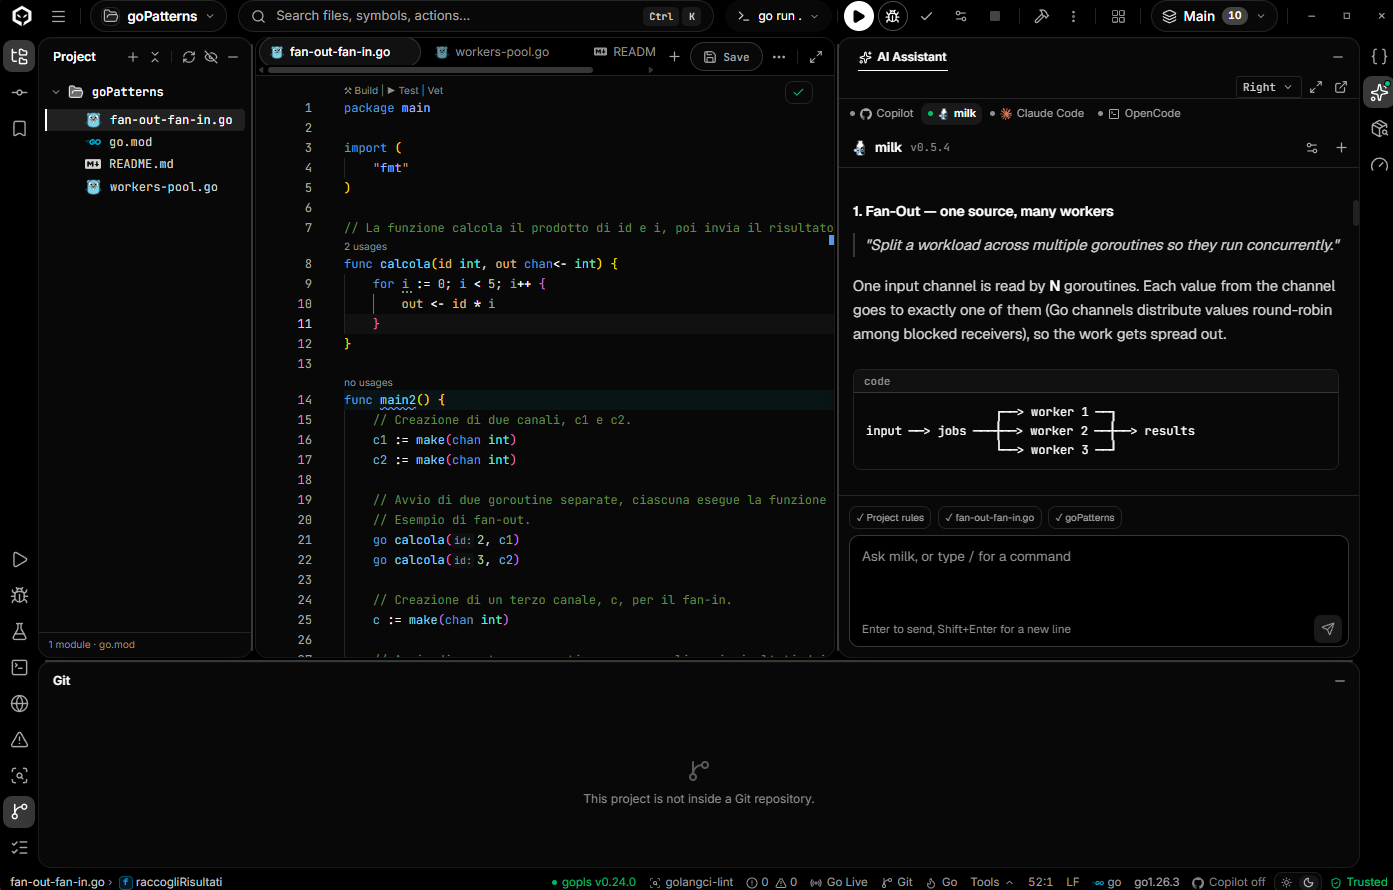
Dependency vulnerabilities in go.mod
Every requirement shows inline actions (update, browse files, replace with local, remove). Known vulnerabilities appear as problems on the exact line, with the advisory ID.
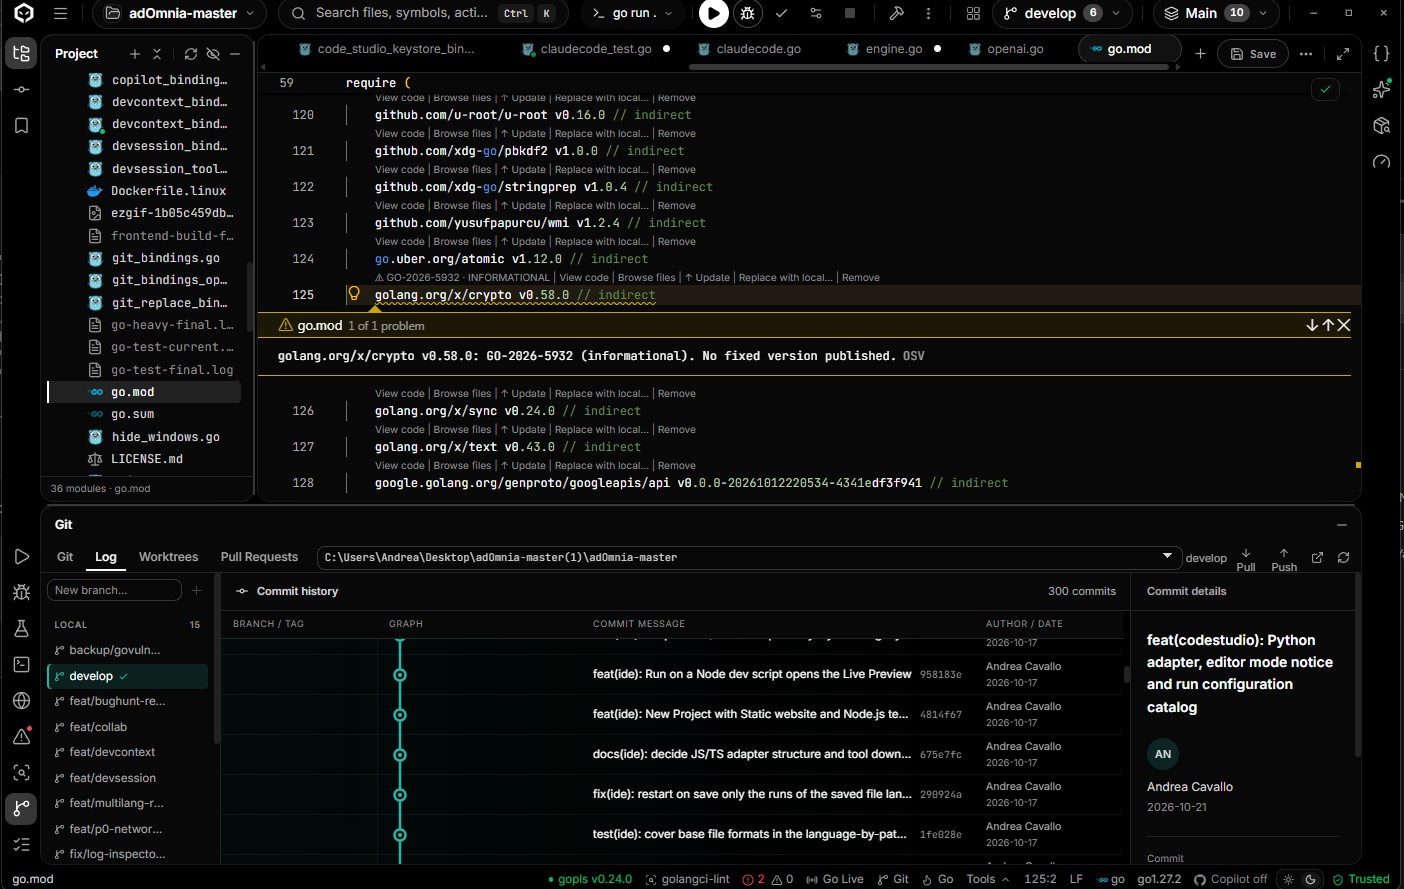
Live Preview
Run a dev server and see the result inside Code Studio, next to the code, with navigation, device modes and the dev-server status in the footer.
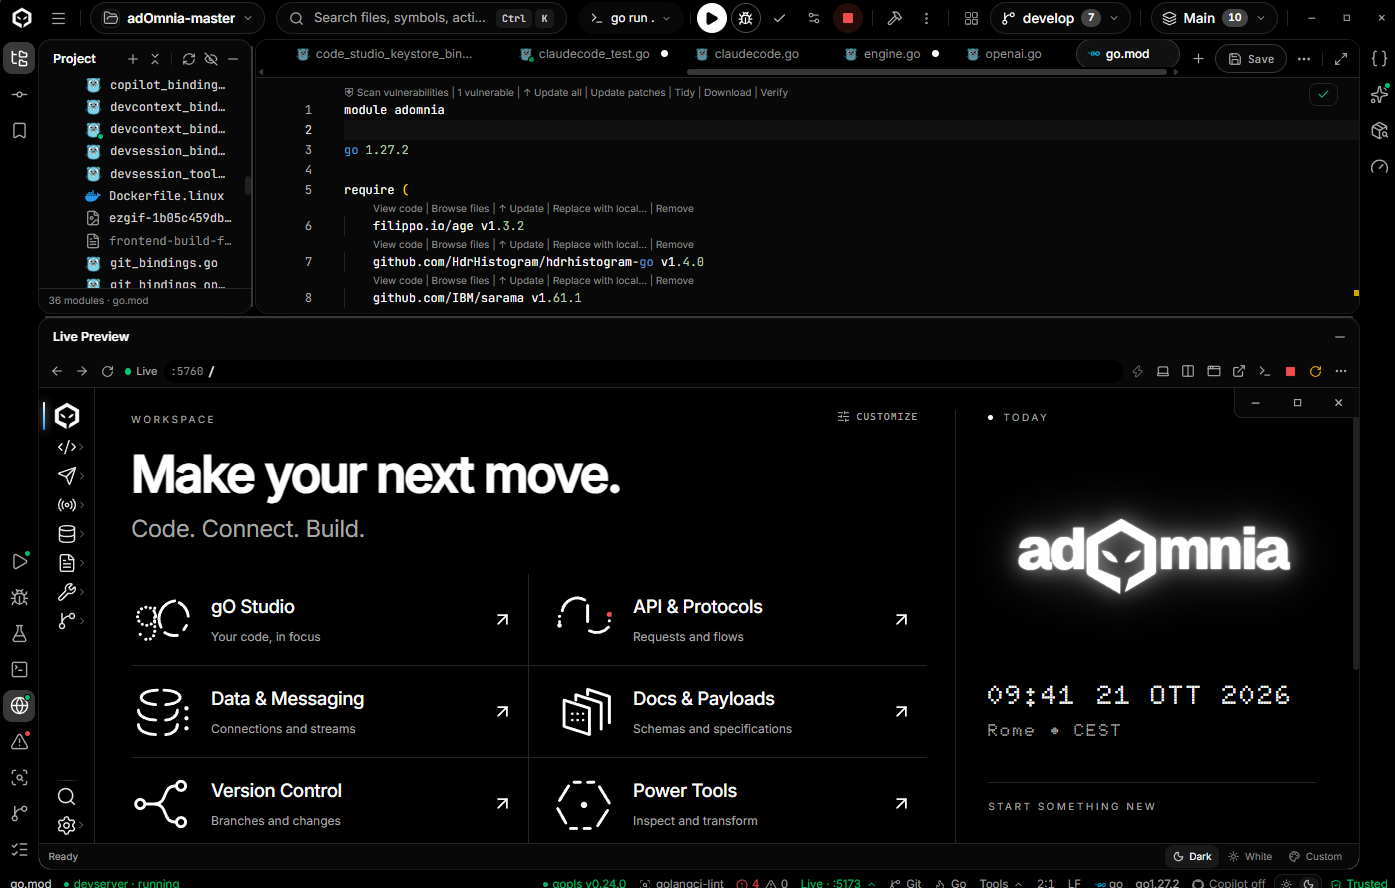
API Workspace
Collections, environments and requests. Routes found in your code become requests, each linked to its handler with Open in Code Studio.
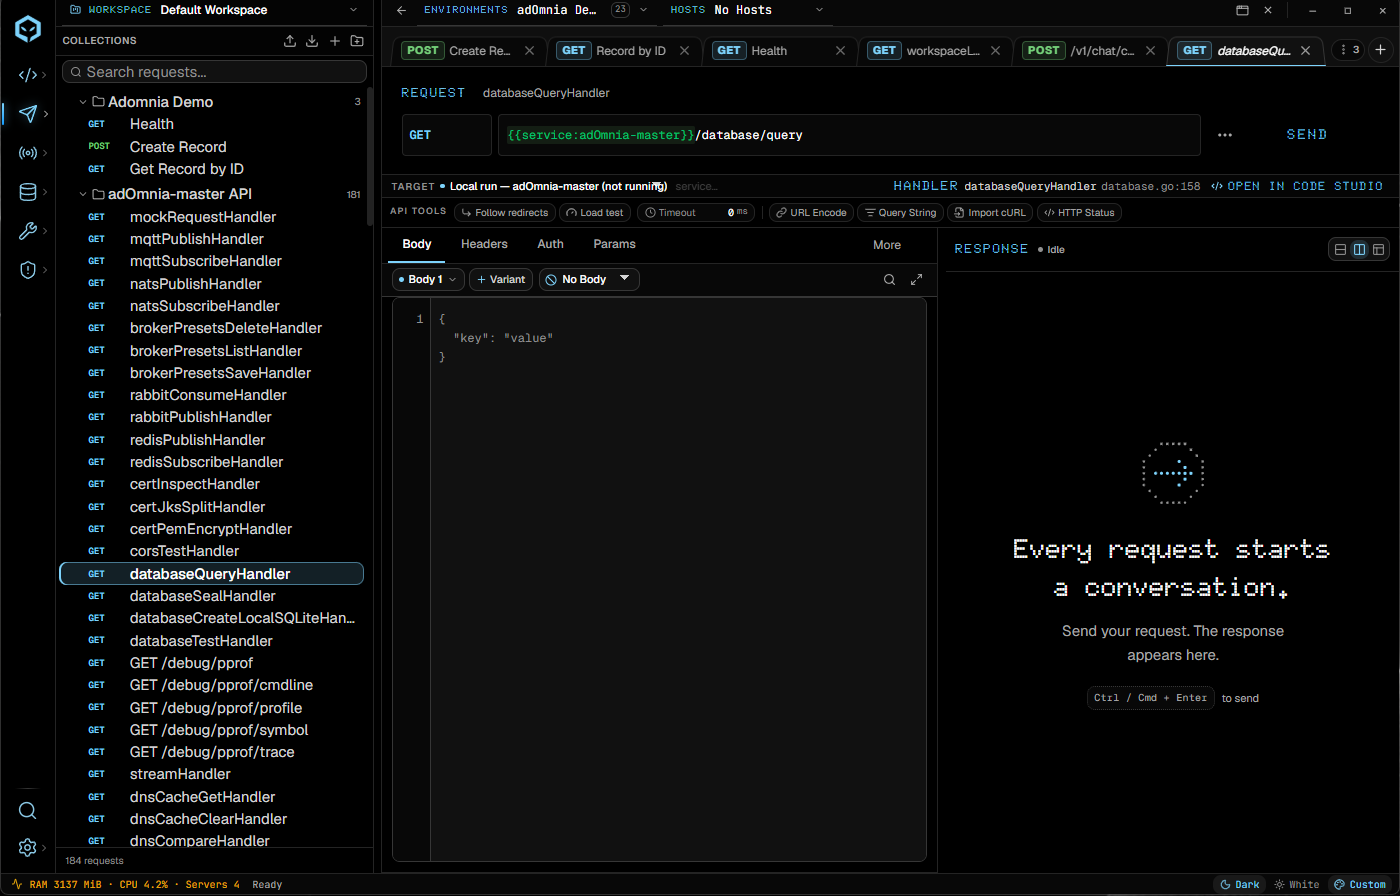
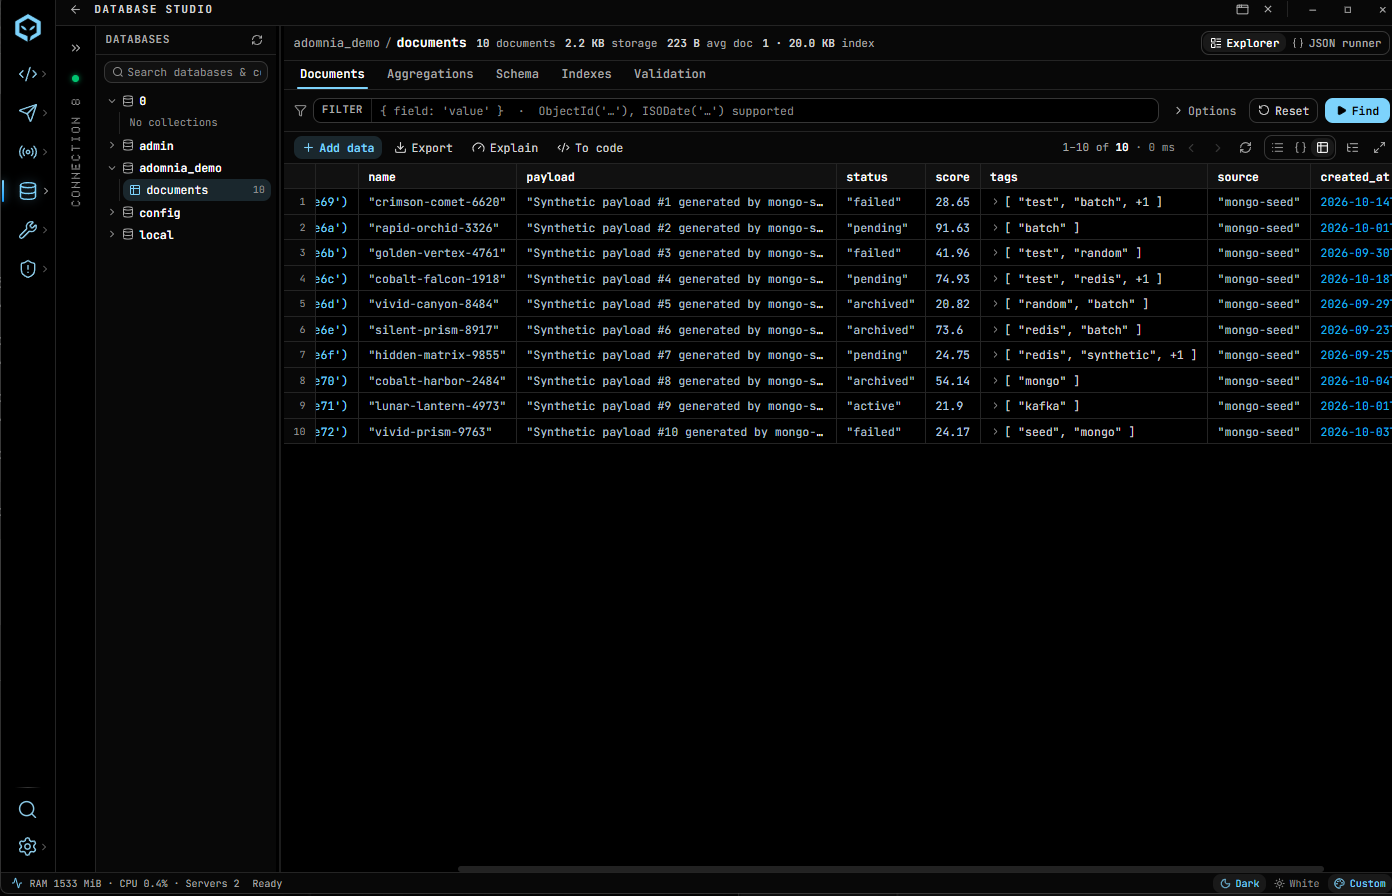
Database Studio
Browse databases and collections, filter documents, run aggregations and inspect schema, indexes and validation. Shown here with MongoDB.
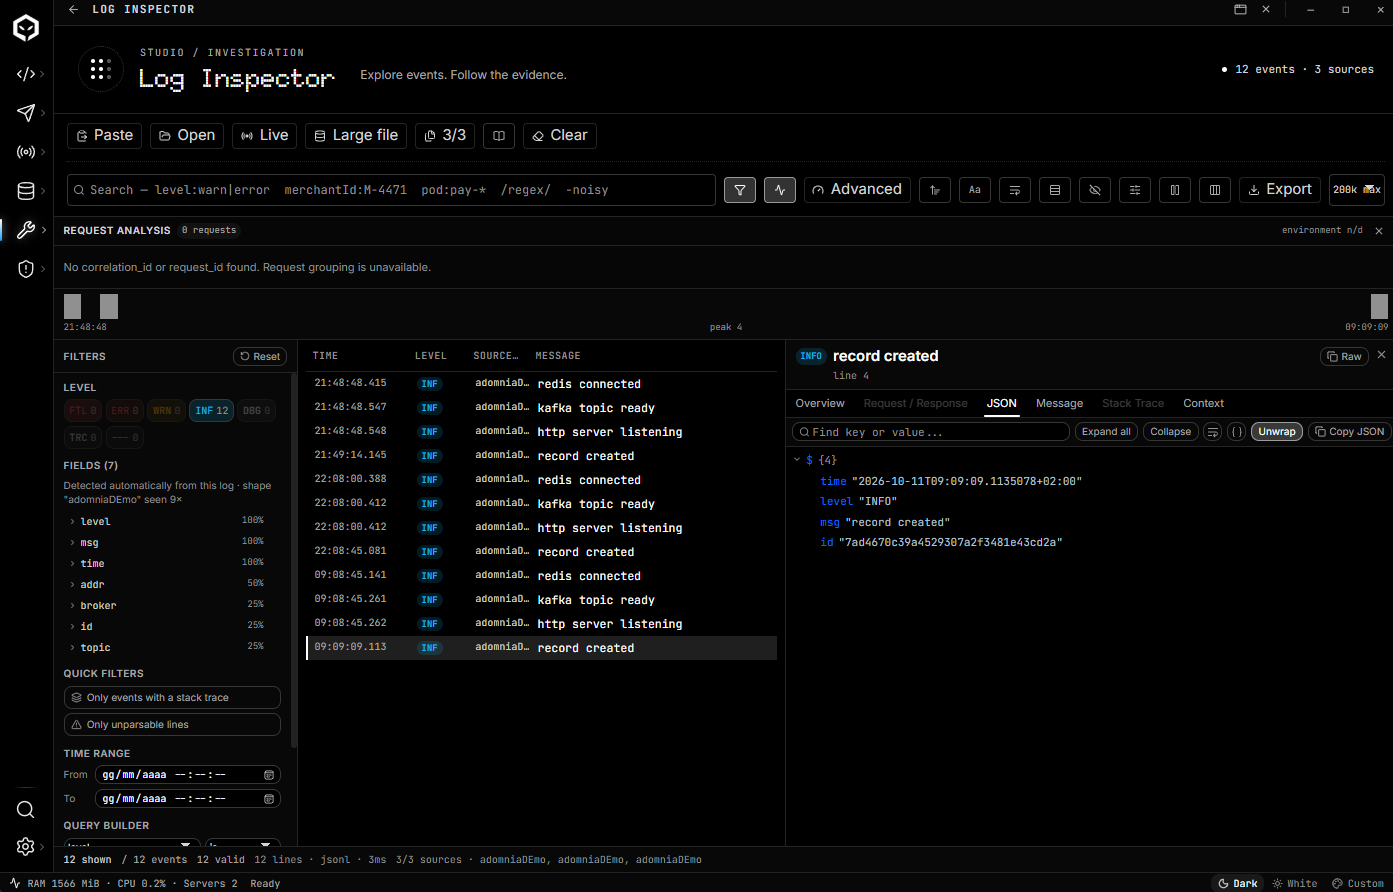
Log Inspector
Open or paste logs, or follow them live. Search with filters, see fields detected automatically, group by request, and read each event as JSON, message, stack trace or context.
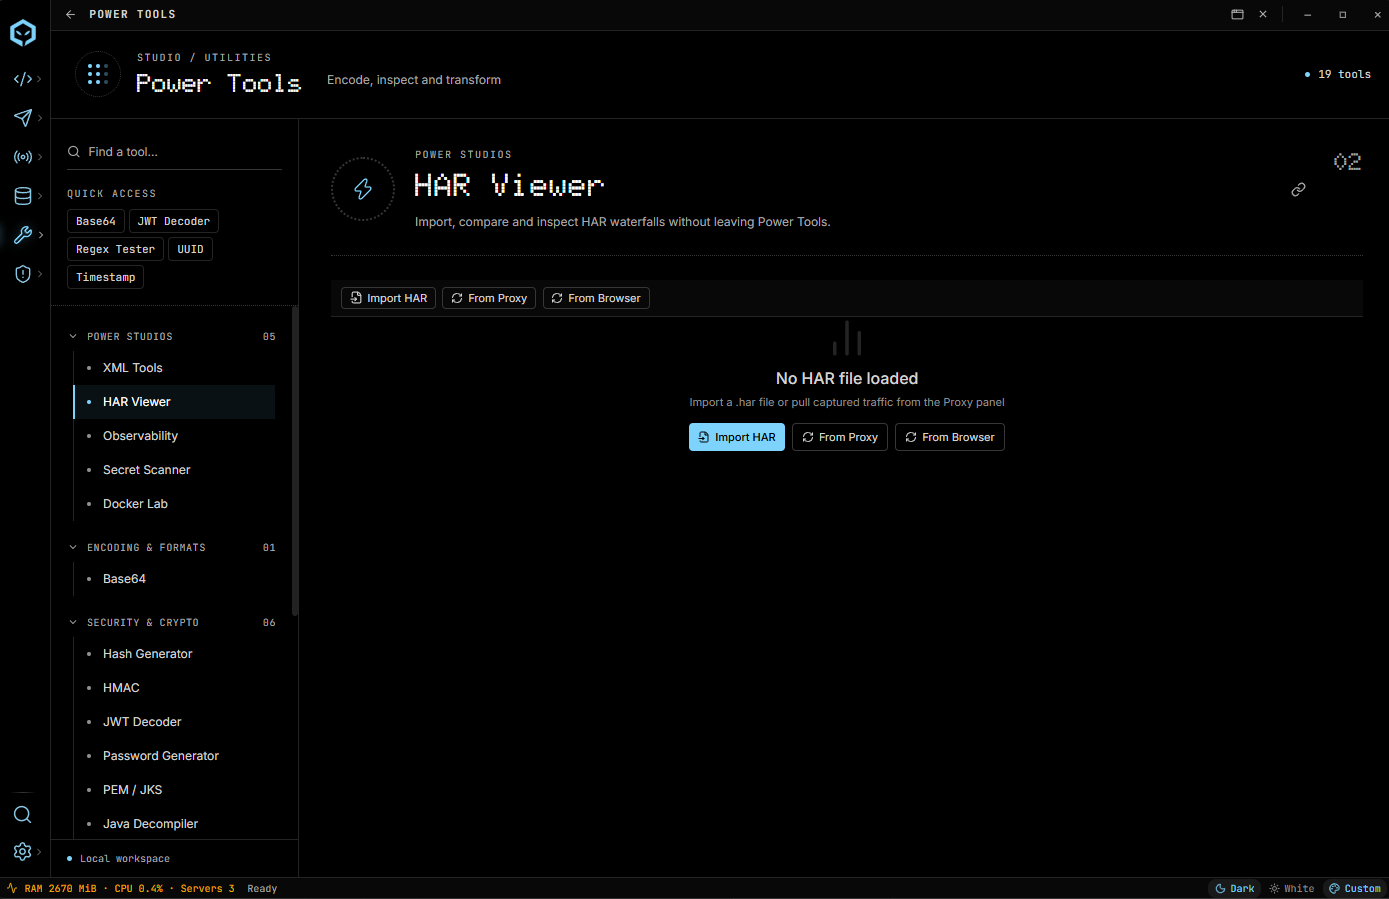
Power Tools
19 utilities in one place: HAR Viewer, XML Tools, Observability, Secret Scanner, Docker Lab, Base64, hashes, HMAC, JWT decoder, PEM/JKS, Java decompiler and more.
Start with your API
- Open API Workspace and create a collection and request.
- Choose a method and URL. Configure Body, Headers, Params and authentication.
- Choose an environment for reusable values such as
{{baseUrl}}. - Press SEND. Inspect the status, timing, response body, headers and test results.
- Save the request to rerun it or share an export.
The API tools work without opening a project.
Follow a request into Go code
- Open the service in Code Studio → File → Open Project.
- Trust the folder to enable Go tools. Configure the SDK and Run/Debug configuration.
- Set a handler breakpoint and start debugging, or use Debug Request from the API request actions.
- Send the matching request. For a recognized route, the HANDLER strip links to its source with OPEN IN GO IDE.
- Inspect the paused frame, variables, stack and goroutines. Step or continue, then return to the response.
See the walkthrough for a first setup, Code Studio for the IDE guide and the technical reference for the platform internals.
Upgrading to Go 1.27? Reinstall the Go tools you already have (golangci-lint, staticcheck, gopls, Delve). Tools built with an older Go cannot read Go 1.27 packages and report errors such as
export data version 5 is greater than maximum supported version 2. Rebuild each withgo install <tool>@latest; Code Studio's own installs already do.
Download and install
Get adOmnia from GitHub Releases.
| Platform | Download | Setup |
|---|---|---|
| Windows x64 | adomnia-<version>-windows-amd64.exe |
Requires WebView2; portable executable, not an MSI wizard |
| macOS Intel / Apple Silicon | adomnia-<version>-macos-universal.dmg |
Install from the DMG |
| Linux x64 | adomnia-<version>-linux-amd64-gtk3-webkitgtk-4.1.tar.gz |
Requires GTK 3 and WebKitGTK 4.1 |
Verify a download against SHA256SUMS.txt on the release page.
First launch, unsigned binaries
- Windows: SmartScreen shows "Windows protected your PC". Choose More info → Run anyway.
- macOS: right-click the app and choose Open the first time, or run
xattr -dr com.apple.quarantine /Applications/adomnia.app.
Binaries are not OS-code-signed yet. The in-app updater (Settings → Check for updates) verifies its own publisher signature and checksum and asks for confirmation before installing.
Installation and updates · Release notes and support limits
Connect Claude (or any MCP client) to adOmnia
adOmnia ships a local MCP server over stdio: adomnia mcp [collection-folder]. No port, no account, nothing leaves your machine. The agent can read, create and update collections, discover API routes in a Code Studio project, run requests and drive the mock server.
Register it in Claude Code (use the full path of the adOmnia executable). The optional last argument is the default collection folder: use an existing folder exported with Export, or a new destination for a collection generated by the agent:
claude mcp add adomnia -- "C:\path\to\adomnia.exe" mcp "C:\path\to\my-collection"
Claude Desktop, Cursor and other clients take the same command in their JSON config:
{
  "mcpServers": {
    "adomnia": {
      "command": "C:\\path\\to\\adomnia.exe",
      "args": ["mcp", "C:\\path\\to\\my-collection"]
    }
  }
}
| Tool | What it does |
|---|---|
project_list_routes |
Statically discover HTTP routes in a Code Studio project, with method, path, source file and scan warnings |
collection_create_from_code |
Create a collection from project routes, or synchronize its generated requests on a later run |
collection_list_requests |
List requests (id, name, method, URL and folder) |
collection_get_request |
Read one complete request by id: headers, params, bodies, auth, assertions and scripts |
collection_upsert_request |
Create or replace a complete request, optionally inside a slash-separated folder path |
collection_delete_request |
Delete a request by id |
collection_list_environments |
List environments and variables, masking secret values and secret-looking names |
collection_upsert_environment |
Create or replace an environment; with merge: true, update only supplied variables and preserve the others |
collection_delete_environment |
Delete an environment and all its variables by name |
collection_run |
Run requests and their tests against real endpoints; filter by folder, env, vars |
collection_benchmark |
Repeat a collection 1–20 times and report latency percentiles and per-request failure rates |
mock_start / mock_stop / mock_status |
Start the local mock server from a config (port, endpoints), stop it, check it |
mock_hits / mock_clear_hits |
See what your code actually sent to the mock, or reset the log |
stress_run |
Execute an exported .stress.json plan and report performance and release-gate results |
app_startup_time |
Measure cold-start latency of a fresh adomnia mcp process |
performance_report |
Build a Markdown performance report from startup, collection and stress measurements |
Every tool carries a title and read-only / destructive / open-world hints, so clients can auto-approve the safe ones and ask before writes, deletes or network calls.
Create an API collection from Code Studio
Route discovery reuses the Developer Context detectors already used by Code Studio. It currently covers Go, Java/Spring, Python, Rust and OpenAPI contracts. The scan is static: it does not execute the project, start language servers or return .env values.
Ask the agent, replacing both paths with real folders:
Read the routes in `C:\