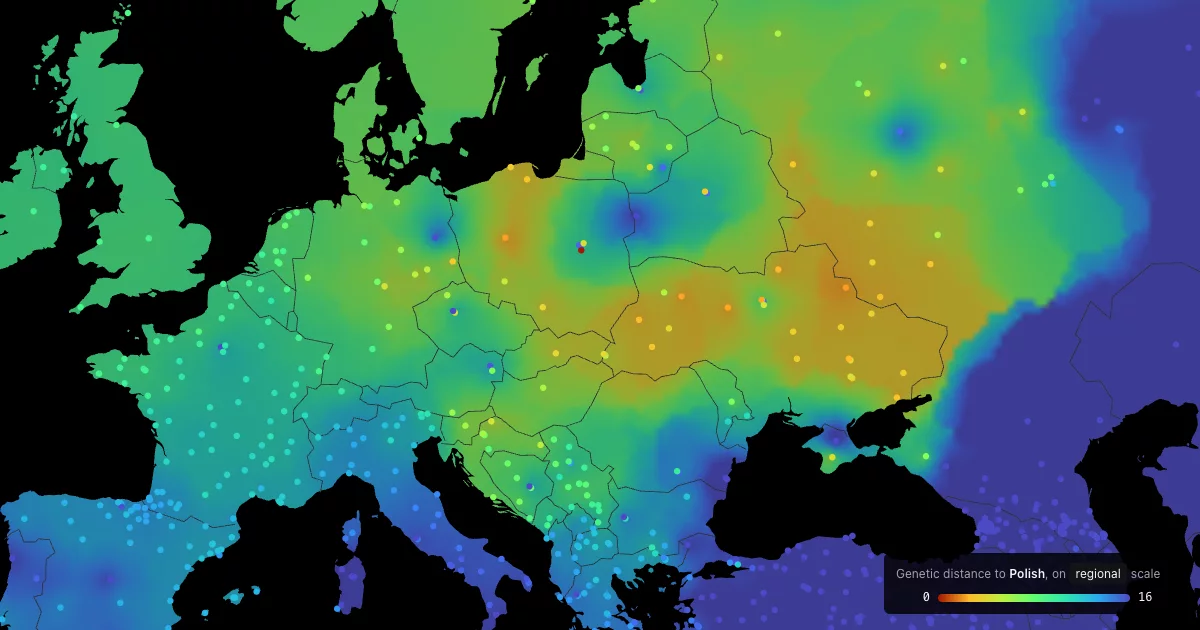

Genetic Distance Map based on G25
Live: p.migdal.pl/genetic-distance-map. Pick a population, present-day or ancient, and see which present-day populations are genetically closest, on a map.
What you are looking at
- Data: Moriopoulos Collection 2025, a hobbyist-curated set of 6,020 population averages (2,080 present-day, 3,940 ancient) built from ~37,000 individual genomes. Not peer-reviewed, no formal licence, freely shared for educational use.
- Coordinates: Global25 (G25), a 25-dimensional PCA of human genetic variation maintained by Davidski (Eurogenes). Each population is a point in that space. The axes are scaled so that the first two, which separate Africa, West Eurasia and East Asia, dominate; within a region the fine structure lives in dimensions 3 to 10.
- Distance: plain Euclidean distance between the 25-dimensional points, times 100, the convention of the G25 community. Polish to Ukrainian is about 1, English to Welsh 0.4, Europe to East Asia 40 and more. It measures similarity of population averages. It is not ancestry share, not a family tree, and says nothing about individuals.
- Clusters (unlisted for now, at /cluster/): Ward hierarchical clustering of the present-day populations on the same coordinates. Every split in the panel is a real branch of that tree; the map is coloured by the cluster of the nearest sampled location. Admixed groups sit on long branches between clades, which is a limit of trees, not a fact about history.
- Locations were assigned to the text labels by a language model (site, region, or ethnic homeland; 575 of 4,453 marked as guesses). They are approximate. Sanity check: the geographic distance to each population's genetic nearest neighbour has a median of 405 km.
- The colour between dots is decorative. It is inverse-distance interpolation over land, computed along land so it follows coasts and never crosses water. It shows nothing that the dots don't.
Caveats worth knowing
- 21% of present-day and 54% of ancient averages are a single individual. Outliers, low-resolution and contaminated entries are excluded from the map but reachable by search.
- Many present-day samples are consumer-test customers with self-reported ethnicity.
- G25 projection of low-coverage ancient samples is biased towards the centre. Ancient distances are less trustworthy than present-day ones.
- Better sources exist for rigour (AADR, HGDP, Human Origins) but none with 2,000 named present-day groups.
Details: DATA_NOTES.md (sources, scaling, geocoding), ANALYSIS.md (why Ward, what the tree agrees with).
Run
cd app && pnpm install && pnpm dev      # http://localhost:5173
pnpm build                              # static site in app/dist
uv run --with pandas --with numpy --with scipy python analysis/build_data.py   # rebuild data
Vite + TypeScript, d3-geo Mercator on a 2D canvas, no map library. Distances are computed in the browser from the 25 coordinates. The panel state and map position live in the URL, so any view is shareable and the Back button undoes steps.
Data viz by Piotr Migdał, 2026. Corrections welcome as issues. Data by Michalis Moriopoulos, Global25 by Davidski (David Wesolowski). Inspired by a Kartografia Ekstremalna post on Poland by Szymon Pifczyk.
Code under the MIT License. The data belongs to its authors, see above.