JanVayu जनवायु
A citizen-led national archive of India's air quality crisis
About
JanVayu (जनवायु, "People's Air") is a citizen-led initiative to build India's first comprehensive public archive of the air quality crisis: its data, its victims, its policies and its public memory.
It keeps a record and runs no campaign.
Live at https://www.janvayu.in
Recent highlights (September 2026)
Forty-three years of PM2.5 are now on the site for 783 of 785 districts. The figures are annual and seasonal (four seasons), run from 1980 to 2022, and come from LongPMInd (Wang et al., Earth System Science Data, 2024; CC BY 4.0). The airshed panel charts them. New Delhi stays flat near 55 µg/m³ through the 1990s, climbs from 1999 and levels off near 90. In winter it rises from about 65 in the 1980s to about 138 in 2013–2022. These decade means match the ones in Hawa Ka Hisab's "Destruction of Delhi" report (51 for the 1980s, 87 for the 2010s), but that report is built on the same LongPMInd data, so the match is a consistency check and not independent confirmation. The series is a reconstruction. It should not be subtracted from the roughly 1 km 2024 satellite layer to show change.
A new panel, "Your airshed, or your town?", asks where a district's air comes from. Across districts, 89.2% of the variance in annual PM2.5 lies between states, and the remainder lies within them. NCAP sets targets city by city. If most of a city's burden arrives from its airshed, a city acting alone can only reach what is left. Pick a district and the panel shows the split. It says plainly that the local gap names no cause.
Two global land-pressure maps, Biodiversity Intactness and Human Footprint (Impact Observatory / Vizzuality), were tested and left out. Across districts they correlate with PM2.5 at −0.61 and +0.62, better than anything else on the site. Once differences between states are held fixed, the added explanatory power (incremental R²) falls to +0.007 and +0.008. At 100 m resolution they mostly show where the Gangetic Plain is. The dataset that looked like our best predictor, and was a map of the Gangetic Plain also describes the join error that nearly led to the wrong table being published.
The monthly update of the current-year air layer had never run. The layer says it is rebuilt on the 3rd of each month, but its first scheduled run failed because a folder it needed to write to did not exist. That is fixed, and the fix was tested with the workflow's own command.
Earlier highlights (August 2026)
The map's air figures are the 2024 satellite annual mean, because SatPM2.5 V6GL03 has published nothing newer. A second layer, at district level, now answers the question everyone asks about this year so far. It uses CAMS estimates via Open-Meteo, corrected against the satellite series for 2024 (r = 0.91, held-out RMSE 5.76 µg/m³ over 200 splits), and is rebuilt on the 3rd of each month. It is never merged with the annual layer, never drawn below district level and never called a measurement.
The site now leads with PM2.5 and not AQI, after a fair criticism at a conference. AQI is a unitless index that reports only its worst pollutant and cannot be averaged over a year. Every Indian limit, health study and NCAP target is written in µg/m³ of PM2.5. The reasoning is in Why JanVayu reports PM2.5 first and AQI second.
Field Testimony grew from 142 to 250 voices, across 107 cities and 14 languages. Field-collected quotes carry their collection date and mode. Every speaker consented and is named as they asked, and code-mixed speech is marked as spoken. The wall is shuffled daily, so no voice stays at the bottom.
The social feeds now say what they can and cannot do. Reddit works again through its public Atom feed, after its JSON interface began refusing requests from data-centre addresses. YouTube is read through channel feeds, and searched when a free Data API key is set. X and Instagram are links out, because neither can be read without a paid or authenticated API. Every X link is checked against X's public embed endpoint before it goes live.
Three things on the site now check themselves. Every stated figure is recomputed from the data, and a mismatch stops a release; this caught a photo count and a ward count that had each been five releases out of date. The homepage blog list is generated from the blog itself. The current-year layer rebuilds monthly.
Two new posts: How to read the JanVayu map, a plain reader's manual, and What the air looks like, on why a data site carries 31 photographs of something 2.5 µm across.
Features
| # | Feature | Description |
|---|---|---|
| 1 | The first screen | Asks what you are breathing. You enter a city, ward or village, or let it read the nearest station, and it replies with an instruction instead of a number. The headline is the verdict, with the reading, the CPCB band, and the same answer for a child, for asthma or COPD, and for going running. Bands follow the CPCB National AQI PM2.5 24-hour sub-index thresholds (30/60/90/120/250 µg/m³) |
| 2 | Ask JanVayu on the homepage | A question box under the first screen, with nine worked examples, in 10 Indian languages. Answers appear in place with their source named, and default to the place you just searched. /ask/ keeps conversation history and offers the installable app |
| 3 | Role-based views | An optional view for 12 audience roles: parent, student, researcher, policymaker, journalist, citizen, activist, doctor, teacher, NGO, business owner, and woman/caregiver. It is offered from the header switcher and never stands in front of the homepage |
| 4 | Simple language mode | A toggle in the header that switches the whole site to simple language. The choice lasts for the browser session |
| 5 | Glossary (Ctrl+K) | A searchable glossary of air quality terms, opened with Ctrl+K |
| 6 | Intro tour | A guided walkthrough of the main sections for first-time visitors |
| 7 | Real-time AQI dashboard | Live PM2.5 and AQI for 157 Indian cities from WAQI and CPCB, with Beijing, London and Singapore alongside for comparison. 33 cities refresh every 10 minutes, and the rest are fetched when you select them |
| 8 | Interactive AQI map | A map with station-level AQI markers across India. You can switch on layers from indianopenmaps.com: live-AQI shading by Lok Sabha constituency ("the air your MP answers for") and by district, assembly-constituency boundaries, and a pollution-sources layer showing landfills, dumpsites, coal mines, CPCB red and orange category industrial parks, and SEZs |
| 9 | Health impact research | Curated evidence from Lancet Countdown 2025, Harvard and IHME studies |
| 10 | Economic cost tracker | The monetised value of premature deaths from outdoor air pollution ($339.4B, 9.5% of GDP; Lancet Countdown 2025), with lost output and healthcare costs shown separately |
| 11 | Policy tracker | NCAP progress, GRAP stage history, and Supreme Court and NGT orders |
| 12 | Citizen voices archive | Social media posts, testimonies and viral content from affected communities |
| 13 | Accountability tracker | How institutions and officials responded to pollution episodes |
| 14 | Social media feeds | Live posts from Reddit (public Atom feed), YouTube (channel feeds, plus search when a free Data API key is set) and Indian news. X and Instagram are links out, not feeds. Neither can be read without a paid or authenticated API, so the site links to live searches and named accounts, and each X link is checked against X's public embed endpoint before it goes live |
| 15 | Daily email digest | A daily AQI summary for your city, emailed at 8:00 AM IST |
| 16 | AQI calculator | A tool for working out AQI breakpoints and the health advice that goes with each |
| 17 | RTI templates | Ready-to-use Right to Information templates for asking about pollution |
| 18 | Action guides | Practical guides on citizen action, choosing a mask and indoor air quality |
| 19 | Downloadable reports | Research papers and datasets to keep for offline reference |
| 20 | Cultural archive | Satire, memes, art and other cultural responses to the pollution crisis |
| 21 | Blog | Updates, data analysis and reflections on India's air quality crisis at janvayu.in/blog |
| 22 | Reading List bibliography | The Reading List's 66 peer-reviewed studies as BibTeX and RIS, built from the list and each DOI's Crossref record by scripts/build-reading-list-bib.py |
| 23 | Ask JanVayu app | The same assistant as an installable app at janvayu.in/ask. It covers 33 cities and 10 languages, takes thumbs up or down feedback, and works on Android, iOS and desktop |
| 24 | Learning games | Seven self-paced educational games at janvayu.in/#games: India-context Air Quality Jeopardy (5×5 board, ₹1k–₹5k tiles), a 10-question PM Quick-Quiz, a 7-source matcher, Clean Air Snakes & Ladders after Moksha Patam, Jodi Match memory cards, Air Tambola (Indian housie), and Vayu Junction, a word-grouping puzzle inspired by Only Connect, NYT Connections and Torchlight, with four sets of India air quality puzzles |
| 25 | Women's health | Gender-specific air pollution analysis: indoor cooking exposure, maternal health, occupational risks and the gender data gap. Linked to the "Woman / Caregiver" role |
| 26 | Historical map overlay | A time slider on the live map showing monthly PM2.5 from Jan 2024 to the present, coloured by pollution level |
| 27 | Automatic updates | The sitemap, site statistics, feed-health checks and translation keys are kept in step without manual work, and the Reading List's citation files are rebuilt from the list itself |
| 28 | Understanding AQI | An interactive breakdown of how the AQI is built from up to eight pollutants (PM2.5, PM10, NO2, SO2, CO, O3, NH3, Pb). The live data and the diagram carry the first six, because ammonia and lead are measured at fewer stations. It also compares the CPCB and US EPA AQI scales and explains why PM2.5 is not the whole story |
| 29 | Shareable AQI cards | Makes a PNG card for Instagram or WhatsApp, coloured by severity, and shares it through the phone's share sheet |
| 30 | Exposure diary | Log 16 daily activities, each with an illustrative (not yet sourced) PM2.5 multiplier, and get a weighted exposure, a cigarette equivalence and a life-expectancy impact |
| 31 | Migration comparison | Compares two cities side by side with live AQI, source apportionment charts and a verdict in life-years gained |
| 32 | Data source selector | Explains how CPCB, WAQI, IQAir and Sensor.Community differ, with a Source Impact Simulator |
| 33 | City policy tracker | An 8-city NCAP target dashboard with expenditure tables, a timeline of government action and public feedback |
| 34 | Ward-level atlas (retired) | Replaced in v26.6.151 by the Boundaries menu on the live map, which now covers 68,596 distinct wards (see rows 45 to 47). The earlier per-city atlas, "How Polluted Is Your Ward?", was a choropleth of the municipal wards of 142 Indian cities, including every state and UT capital. Boundaries come from several sources: 15 collected by hand; 74 from the Swachh Bharat Mission via indianopenmaps.com; 45 from the ESRI India Living Atlas layer; 7 West Bengal cities from the state's AMRUT GIS master plans; and Guwahati from OpenCity/Oorvani via BharatLas under ODbL-1.0. Every city has live PM2.5 (interpolated), an annual satellite PM2.5 layer, heat (Landsat 8/9 surface temperature), green cover and built-up area (ESA WorldCover 10 m). Overlays of schools (UDISE/NCOG) and health centres (Bharatmaps) show who breathes the air. Each layer has a legend, tooltips and live statistics, and the maps show the urban heat-island link from each city's own data |
| 35 | Citizen testimony | A multilingual wall of 250 first-person testimonies on how bad the air is, from 107 cities, in Hindi, English and 12 other Indian languages (Bengali, Tamil, Marathi, Telugu, Kannada, Gujarati, Punjabi, Malayalam, Odia, Urdu, Assamese, Nepali), each with an English translation. Field-collected entries carry their collection date and mode, and each speaker is named as they asked. You can filter by language, search the text and read Urdu right to left. To add your own, write to contribute@janvayu.in |
| 36 | Live 5-day forecast | An independent PM2.5 forecast (Open-Meteo / CAMS, no key needed) in the Forecast panel: daily mean and peak, a band-coloured summary, a trend chart and a 33-city selector. It sits beside reliability tracking for SAFAR/CPCB forecasts. Ask JanVayu can answer "will it be bad tomorrow?" |
| 37 | Farm fire tracker | A live map of stubble burning and farm fires (NASA FIRMS, VIIRS/NOAA-20) across the Punjab–Haryana–NCR belt, with region and time-window toggles. It shows the seasonal pattern, with a peak from mid-October to late November |
| 38 | Beyond the lungs | PM2.5's toll on the whole body: kidneys (a 2026 Chennai–Delhi eGFR cohort), heart and blood vessels, brain, metabolism and pregnancy. It argues for health alerts that cover all of these |
| 39 | Occupational exposure | Who is exposed most, by occupation: street vendors, traffic police, gig riders, and construction and waste workers, built around a 2026 Chennai street-vendor study |
| 40 | Open data API | A versioned, open public data API at janvayu.in/api: a manifest of every dataset and a CSV export of rankings. Free to use with attribution (CC BY-NC-SA 4.0) |
| 41 | Hand-drawn diagrams | Diagrams in a hand-drawn style: the system diagram, "How the AQI number is built", "PM2.5 through the body", "How dirty air drains the economy", and the blog headers. Each has a wide desktop version and a portrait mobile version. Sources are in assets/diagrams/ |
| 42 | Photo gallery | "The air, in pictures": 31 documentary photographs (29 openly licensed or public-domain images from Wikimedia Commons, and two by Bryan Denton for The New York Times, shown with permission), in a grid that opens full screen, with credit and source for each image |
| 43 | Web push alerts | An installable app that sends real alerts when air crosses a threshold, even when the site is closed |
| 44 | Automated fact-check | A periodic routine (currently unscheduled) checks every statistic and calculator constant against current primary sources on the web and opens a review. Findings are archived in docs/fact-check-*.md |
| 45 | Village boundaries | A Villages layer on the live map covering all 584,615 Indian village boundaries (LGD via indianopenmaps.com). It loads at zoom 9 and above, and only for districts in view |
| 46 | Annual PM2.5 per village | Every one of the 584,615 villages has an annual mean PM2.5 from SatPM2.5 V6GL03 (ACAG, Washington University; a CNN over satellite AOD and GEOS-Chem, about 1 km, CC BY 4.0). The ~565-station live network can never offer that: 100% coverage. Villages are coloured by the figure and banded against the WHO guideline (5) and India's NAAQS limit (40). The live estimate stays separate in the popup, because the two cover different timescales, and the card notes that a ~1 km product smooths over very local sources. Not one village meets the WHO guideline, and 63.6% exceed India's own limit of 40 |
| 47 | Annual PM2.5 per ward | Every one of the 68,596 distinct wards has an annual mean PM2.5 from the same SatPM2.5 V6GL03 grid (the 2024 annual mean), on the Boundaries menu of the map. This replaced the earlier per-city Ward Atlas, which covered 142 cities and was retired in v26.6.151. Unlike the live snapshot it can fairly be set beside the heat, tree cover and built-up layers on the same ward. The colour bands are absolute µg/m³ and are the same at every level. Ask JanVayu can use these figures too |
| 48 | Airshed decomposition | "Your airshed, or your town?" 89.2% of the variance in district annual PM2.5 lies between states, and the remainder within them. Pick any of 785 districts to see how the gap between its air and the national median divides into its region and its own local deviation. State medians run from Delhi (92.7 µg/m³) to Ladakh (13.9). The panel makes the case for managing air by airshed, using India's own district figures, and says plainly that the gap names no cause |
Key statistics (July 2026)
| Metric | Value | Source |
|---|---|---|
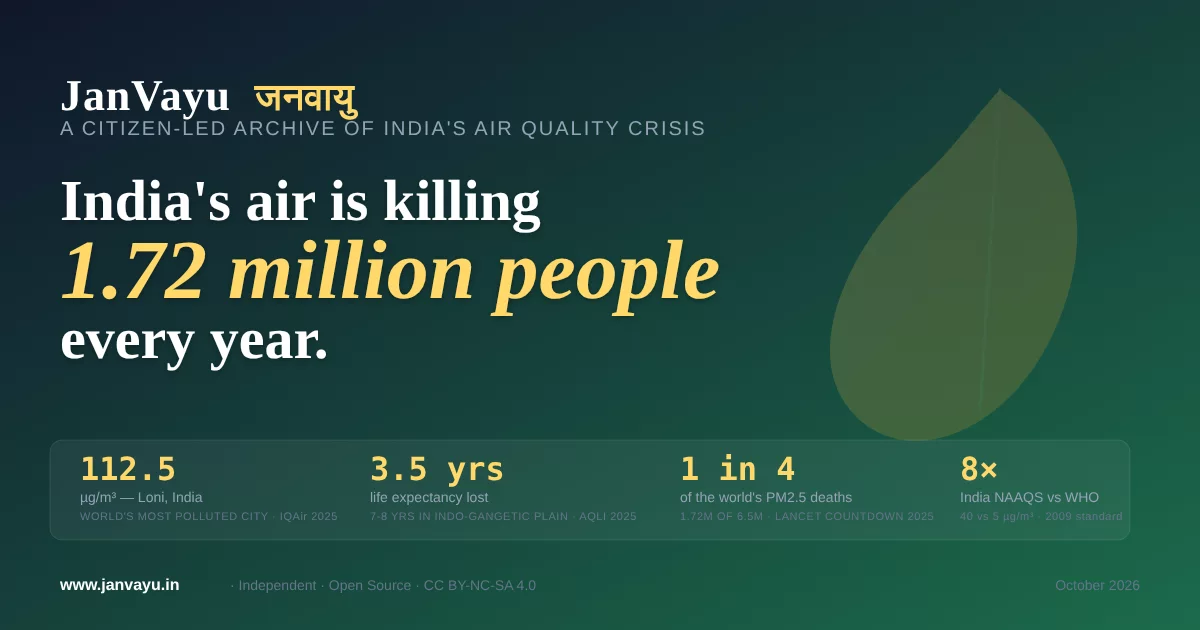
| Annual PM2.5 Deaths | 1.72 million | Lancet Countdown 2025 |
| Economic Cost | $339.4 billion (9.5% GDP) | Lancet Countdown 2025 |
| India's Global Share | India and China each recorded more than 2 million air-pollution deaths in 2023 (of 7.9 million worldwide) | State of Global Air 2025 |
| Most Polluted Capital | New Delhi (82.2 µg/m³) | IQAir 2025 |
| Most Polluted City | Loni, India (112.5 µg/m³) | IQAir 2025 |
| Cities Meeting WHO Guideline | Only 14% globally | IQAir 2025 |
| India Average PM2.5 | 48.9 µg/m³ (nearly 10 times the WHO limit) | IQAir 2025 |
| Life Expectancy Loss (India) | 3.5 years | AQLI 2025 |
How it is built
JanVayu is a light site with no front-end framework. Social and news feeds are gathered on the server:
┌─────────────────────────────────────────────────────────┐
│                     Client (Browser)                    │
│  Single-page HTML app · Chart.js · Leaflet.js · WAQI   │
└──────────────────────────┬──────────────────────────────┘
                           │
              HTTPS (Netlify CDN)
                           │
┌──────────────────────────▼──────────────────────────────┐
│                   Netlify Functions                      │
│                                                          │
│  Scheduled (cron)              On-demand (API)           │
│  ┌──────────────────┐   ┌───────────────────────────┐   │
│  │ scheduled-fetch   │   │ reddit-feed.js            │   │
│  │ (every 4 hours)   │   │ twitter-feed.js           │   │
│  │                   │   │ news-proxy.js             │   │
│  │ daily-digest      │   │ instagram-feed.js         │   │
│  │ (8 AM IST daily)  │   │ feed-status.js            │   │
│  └────────┬──────────┘   │ subscribe.js              │   │
│           │              └─────────────┬─────────────┘   │
│           │                            │                  │
│           ▼                            ▼                  │
│  ┌─────────────────────────────────────────────┐         │
│  │           Netlify Blobs (Cache)              │         │
│  │  Feeds cached as JSON · Strong consistency   │         │
│  └─────────────────────────────────────────────┘         │
│                                                          │
│  ┌─────────────────────────────────────────────┐         │
│  │         Resend (Email Delivery)              │         │
│  │  Daily AQI digest to subscribers             │         │
│  └─────────────────────────────────────────────┘         │
└──────────────────────────────────────────────────────────┘
Main design choices:
- The whole front end is one
index.htmlwith its CSS and JavaScript inline. There is no build step, bundler or framework. - Social media and news