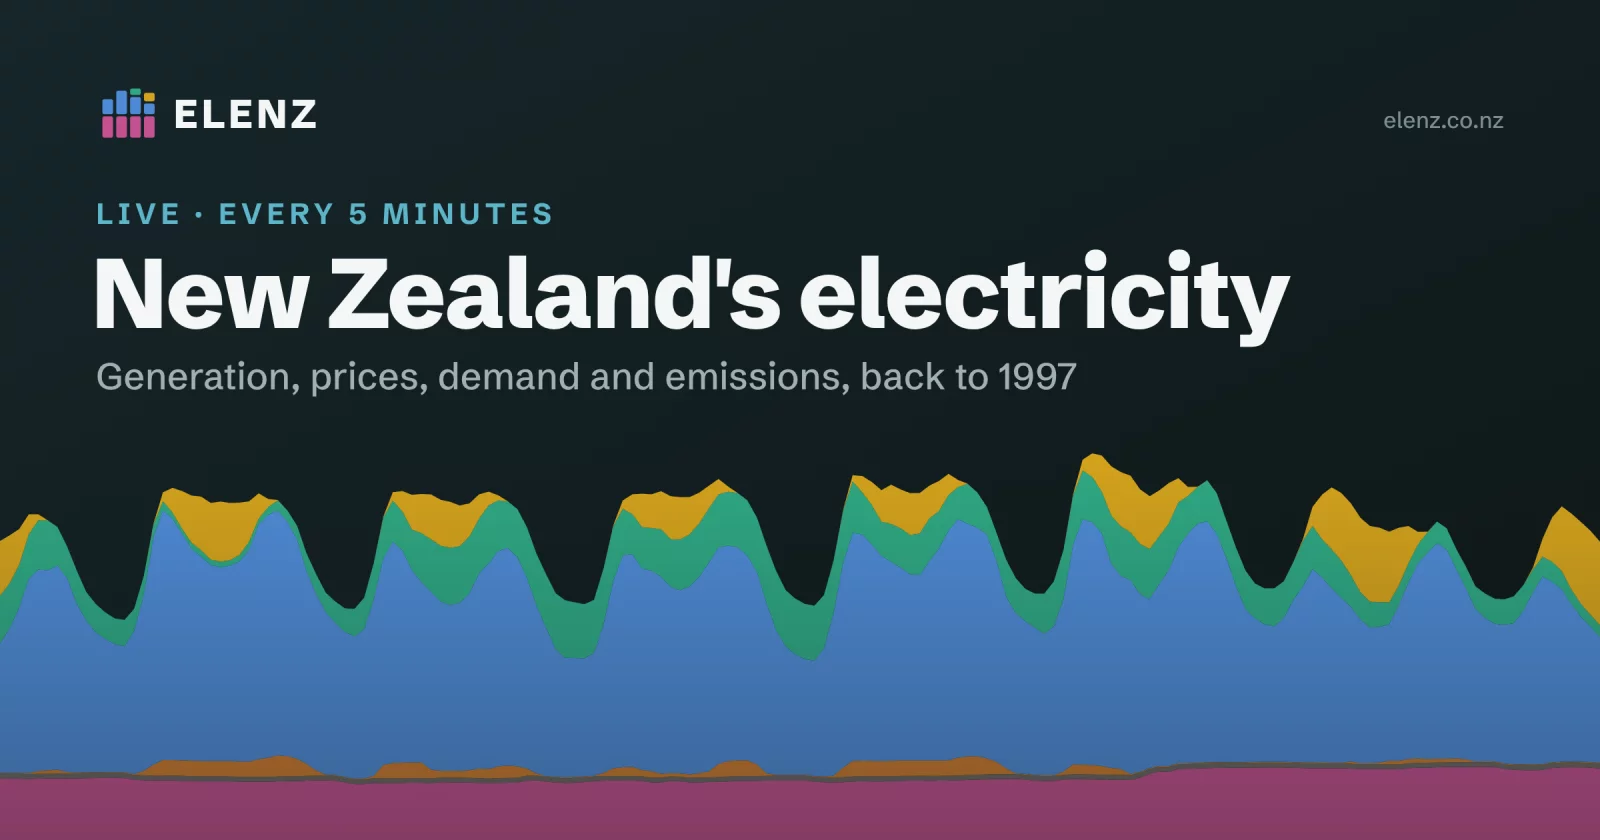

Live, open data on New Zealand's electricity system: generation by fuel and plant, wholesale prices, demand, HVDC transfer and emissions, every 5 minutes and back to 1997. Built on free Electricity Authority data (CC BY 4.0).
Site: https://elenz.co.nz
| Page | What's on it |
|---|---|
/ |
Landing page: live total generation, the mix right now, the last 24 hours, and a glimpse of each page |
/now |
Live figures (demand, renewable share, island prices, HVDC, emissions, embedded solar), a map of each island's mix, a price explainer ("Why is the price high?") and every generator's output right now |
/tracker |
Linked charts on one time axis: generation by fuel (drill down to plant), prices, demand, HVDC, emissions intensity, renewable share. 1 hour to All (since Aug 1997), NZ or either island; every view has its own link, and charts download as PNG or CSV |
/tracker/prices |
Six node prices, the island spread and HVDC; daily price ranges, price captured by fuel, a time-of-day heat map |
/records |
The highest and lowest half-hours, days, weeks, months, years and runs since 1997 for NZ and each island, each with its own page (how it grew, the period it fell in); provisional records from the live week and periods heading for a record |
/articles |
Quarterly reviews, records and analysis |
/about |
What Elenz is, what each page shows, support and contact |
/methods |
Data and methods: every dataset used, and a page per series with its calculation, checks and limits |
/privacy |
What the site collects (cookie-free analytics, settings kept in your browser) |
How it fits together
                    Cloudflare cron (in the site's Worker)
                     │ every 5 min           │ every 6 h (and offers.yml)    │ every 15 min
                     ▼                       ▼                               ▼
EMI dispatch API ─► ingest/update.py   EMI metered data ─► ingest/history.py  .github/workflows/watchdog.yml
                     │ (GitHub Actions)  daily dispatch files, │ (GitHub Actions) opens an issue if data
                     │                   final prices, HVDC ───┤                  goes stale
                     ▼                                         ▼
              Workers KV: tracker.json (7 days)      Workers KV: hist/* (since Aug 1997)
                     └──────────────► worker/index.js ◄────────┘
                                      serves the site (site/) and /data/*
The live week comes from the EMI real-time dispatch API. History comes from the EA's metered data
(ingest/metered.py: Generation_MD, Embedded_generation, grid exports and imports, Tiwai, HVDC flows) for every month
the EA has published (about 5–6 weeks behind), and from the daily dispatch files (from 10 Sep 2020) for the weeks since
and for plants the metering lacks. Prices in history are the EA's final prices.
Embedded solar is modelled (ingest/rooftop.py, ingest/pv.py: installed capacity from the EA registry less
dispatched farms, Himawari satellite irradiance, ERA5 before 2016). HVDC is metered where published, otherwise
estimated (ingest/hvdc.py). Emissions are calculated in the browser (site/src/lib/tracker/emissions.js: Huntly's
Rankines by Genesis's quarterly coal share, geothermal per station by year). analysis/ holds the scripts and
evidence behind every estimate (analysis/README.md).
| Folder | What's in it |
|---|---|
site/ |
The website (SvelteKit 3 + Svelte 5, built to static files and hosted on Cloudflare Workers; see wrangler.jsonc) |
worker/ |
The Cloudflare Worker: serves the site and the data from KV, and starts the GitHub jobs on a schedule |
ingest/ |
Python jobs that download EMI data and build the JSON the website reads |
facilities/ |
Hand-maintained corrections to the EA plant register, the metered plant table, and the embedded solar points and capacity |
analysis/ |
Development scripts and the evidence for the solar, HVDC, emission factor and metered history estimates, and the data behind each article |
data/ |
Downloaded raw data. Not committed; recreate it with the ingest scripts |
Running it on your own computer
You need Node.js (version 22 or newer) and Python 3.11 or newer (the jobs run on 3.13).
Website only (uses the data snapshot already in site/static/data/):
cd site
npm install
npm run dev
Then open http://localhost:5173.
Refreshing the data:
pip install -r ingest/requirements.txt
python3 ingest/sync.py all                 # plant register, irradiance, last week of daily files
python3 ingest/emi_live.py latest          # newest 5-minute interval (needs an EMI API key, below)
python3 ingest/build_tracker.py            # rebuild site/static/data/tracker.json
The live API needs a free key from emi.developer.azure-api.net (subscribe to
"Wholesale market prices"). Put it in a file called .emi_key in this folder, or set the EMI_KEY environment
variable. .emi_key is git-ignored; never commit the key.
Checks (the same ones GitHub runs on every push, in .github/workflows/checks.yml):
python3 ingest/tests/smoke.py              # live and history paths on committed sample data, no network
cd site && npm run check && npm test && npm run build && npm run check:previews
main is protected: changes go in through a pull request, which can merge only once these checks pass. Every merge
redeploys the site, and the data jobs run the new code within 5 minutes.
Each branch also gets a preview of the site with live data at https://<branch>-elenz.elenz.workers.dev
(Cloudflare Worker Previews), to check a change before it merges.
How the data updates
Live: .github/workflows/update-data.yml runs ingest/update.py on GitHub every 5 minutes, started by a
Cloudflare cron trigger in the site's Worker (GitHub's own schedule is too unreliable to depend on and stays only as a
backup). It fetches new intervals from the EMI API, fills any gaps in the 7-day window, keeps a compact store
(state.csv.gz) and rebuilds tracker.json, saving both to Cloudflare Workers KV. A run with no new data saves
nothing. The Worker (worker/index.js) serves /data/tracker.json from KV with an ETag, so pages that check again
before anything has changed get a 304 with no body. Code changes and data updates never overwrite each other.
Run the same job on your own computer with python3 ingest/update.py (it uses data/store/ instead of KV).
History: .github/workflows/history.yml runs ingest/history.py every 6 hours. It builds each month from metered
data once the EA publishes it, adds newly published daily dispatch files and final prices, and writes per-month
half-hourly files and one daily file to KV, plus the records (ingest/records.py), the heat maps' monthly averages
(ingest/tod.py) and the price explainer's usual values (ingest/explain.py). .github/workflows/offers.yml, started
with it, reduces the EA's daily generator offers to offered capacity by plant (ingest/offered.py). History keeps to 280 KV writes a day (the free plan allows 1,000 and the live
job uses about 600), so a full rebuild of every month since 1997 takes about four days; bump BUILD in history.py
after changing how months are built. Changes to the plant register, facilities/overrides.toml or
facilities/metered_plants.csv trigger a rebuild automatically.
Secrets: repository secrets EMI_KEY, CF_ACCOUNT_ID and CF_API_TOKEN (Workers KV: Edit); Worker secret
GITHUB_TOKEN (fine-grained, this repository only, Actions read/write). The token expires, so renew it yearly or the
updates stop.
Monitoring: /data/status.json shows the last trigger result for each job, and /data/history/progress.json
the history job's progress. /data/health returns 200 while live data is under 45 minutes old (the EA's feed sometimes stalls for ~30 minutes and catches up) and history under
5 days behind (12 during a rebuild), and 503 with the reasons otherwise; an outside uptime monitor checks it.
.github/workflows/watchdog.yml opens a stale-data issue on the same conditions and closes it on recovery.
When the build warns about a unit
New plant appears in the dispatch feed months before the EA's plant register catches up. If
build_tracker.py prints WARNING unmapped generating units, add the unit to [units] in
facilities/overrides.toml with its fuel and plant name, then rebuild. After refreshing the register
(python3 ingest/sync.py plants, review the diff) or editing the owner and scheme tables, rerun
python3 ingest/plant_meta.py and commit site/src/lib/tracker/plants.json.
The history job warns the same way about Generation_MD codes it doesn't know: add them to
facilities/metered_plants.csv.
Data and licence
Data from www.emi.ea.govt.nz provided by the Electricity Authority (New Zealand), CC BY 4.0 (the EA confirmed in October 2026 that this covers republishing and derived data, with attribution). Irradiance: Himawari satellite data (JMA/JAXA) via Open-Meteo, CC BY 4.0; ERA5 reanalysis (Copernicus) via Open-Meteo for 2013–15. Coal share of Huntly's Rankines before FY21 from MBIE energy statistics, CC BY 4.0.
The code has no licence file yet, so all rights are reserved.