

GridSite scores every sizeable industrial site in the San Francisco Bay Area and the Stockton / Central Valley freight corridor on one question: if you wanted to charge a fleet of electric trucks here, how close is the power? It pulls public grid data every week, ranks 1,390 sites, and publishes the result as a map anyone can click through.
🗺️ Open the live map · 📄 Download the scores (CSV) · Run it yourself · How a site is scored
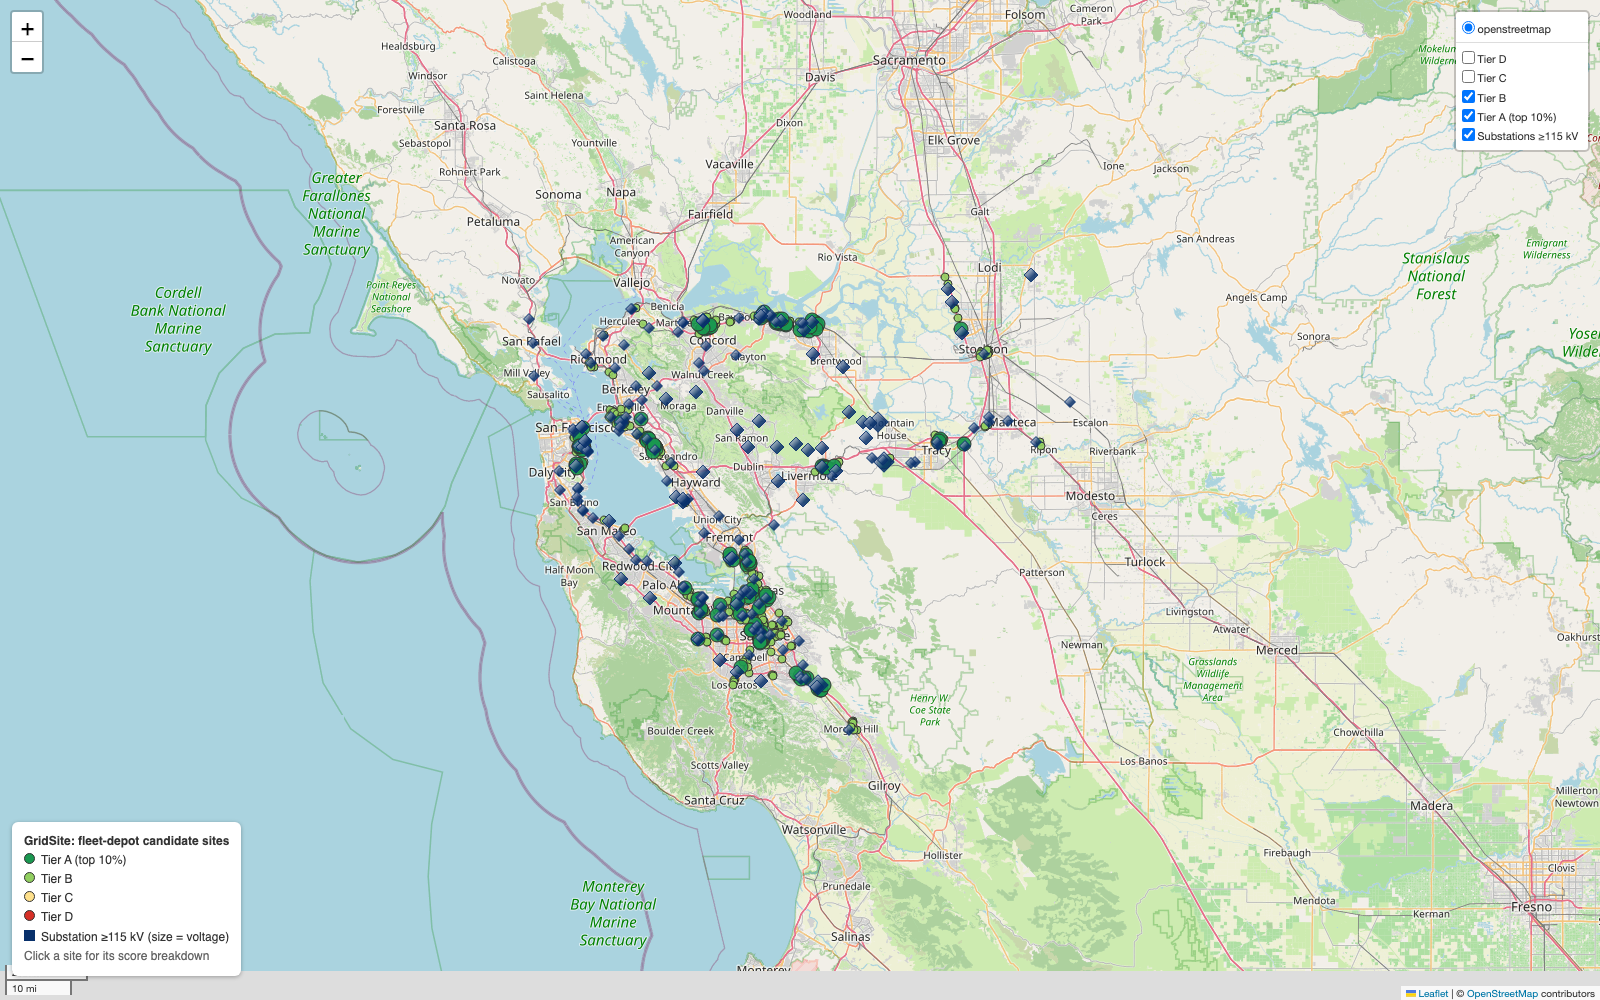
Green dots are the best sites, dark-blue diamonds are high-voltage substations. Click the image for the live map.
The 30-second version
An electric truck depot isn't limited by chargers. It's limited by power. Charging dozens of trucks overnight takes megawatts, about as much as a small neighborhood, and the cheapest, fastest way to get that much power is to build right next to the high-voltage grid. Build far from it and you can wait years and pay millions for new lines.
So the first question in picking a depot site is a map question: which empty industrial lots sit close to a big substation and close to the freeway the trucks already drive?
GridSite answers that for two regions, using only public data, and refreshes the answer every Monday:
| 🏭 Industrial sites scored | 1,390 (≥ ~2 acres; power plants and hazardous uses excluded) |
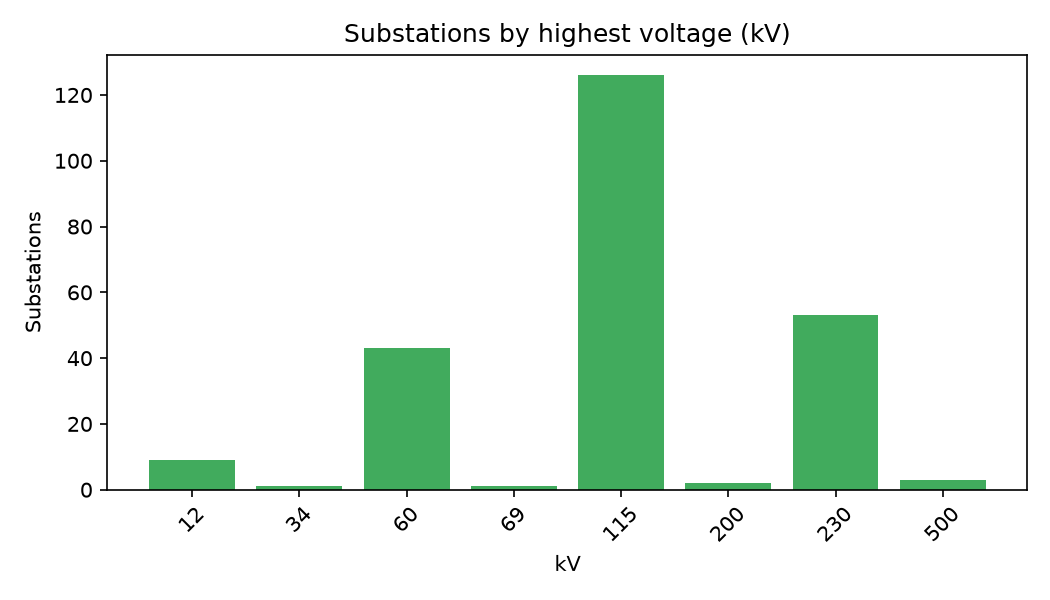
| ⚡ Substations mapped | 536, of which 184 are high-voltage (≥ 115 kV) |
| 🛣️ Freeway exits checked | 1,591 |
| 📏 Typical distance from a site to the high-voltage grid | 2.05 km (median) |
| ✅ Automated tests | 28, run on every change |
| 🔄 Data refresh | weekly, automatically |
From the run on 2026-10-28. Every refresh rewrites summary.json.
What it found
The Bay Area is grid-rich and Stockton looks grid-poor. That's the headline:
| Region | Sites | High-voltage substations | Typical distance to one | Median score | Top-tier sites |
|---|---|---|---|---|---|
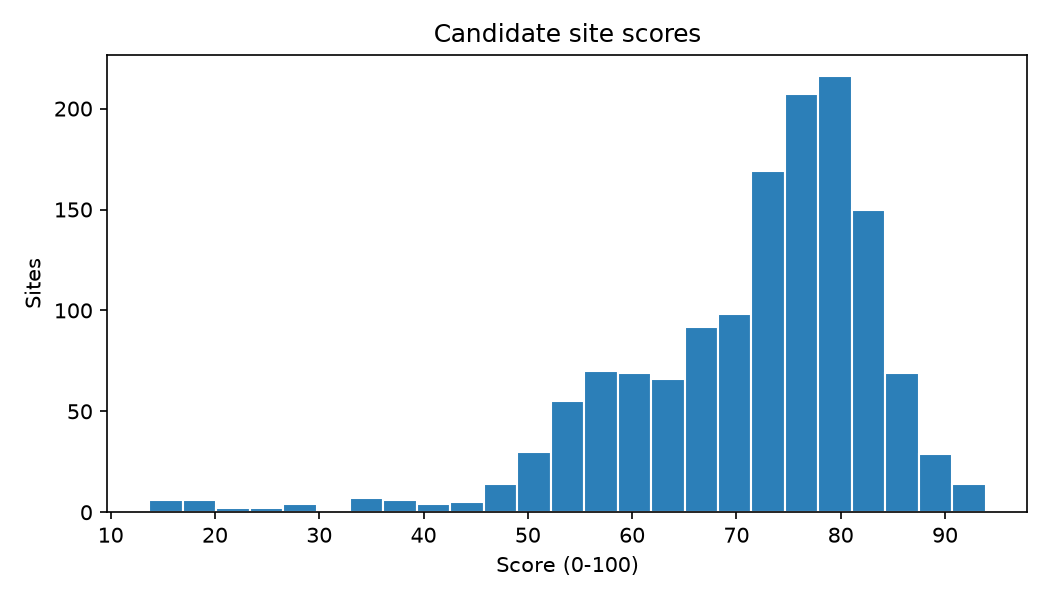
| 🌉 Bay Area | 912 | 168 | 1.67 km | 77.0 | 136 |
| 🚚 Stockton / Central Valley | 478 | 16 | 3.49 km | 65.5 | 5 |
Stockton is one of the most important freight hubs in California, exactly where fleets will electrify, yet the public map shows 10× fewer high-voltage substations and twice the distance to reach one. Either that's a real constraint on electrifying Central Valley freight, or OpenStreetMap is missing substations there. Either way, it's the first thing to check against the utility's own maps.
The best sites cluster along the transmission backbone:
| Rank | Score | Next to | Voltage | To the substation | To a freeway exit |
|---|---|---|---|---|---|
| 1 | 93.9 | Metcalf Substation, south San José | 500 kV | 0.41 km | 0.76 km |
| 2 | 93.8 | Las Positas Substation, Livermore | 230 kV | 0.25 km | 0.20 km |
| 3 | 93.1 | Contra Costa Substation | 230 kV | 0.09 km | 0.51 km |
| 4 | 92.6 | Northern Receiving Station, Santa Clara | 230 kV | 0.09 km | 0.45 km |
| 5 | 92.2 | Contra Costa Power Plant Substation | 230 kV | 0.80 km | 0.13 km |
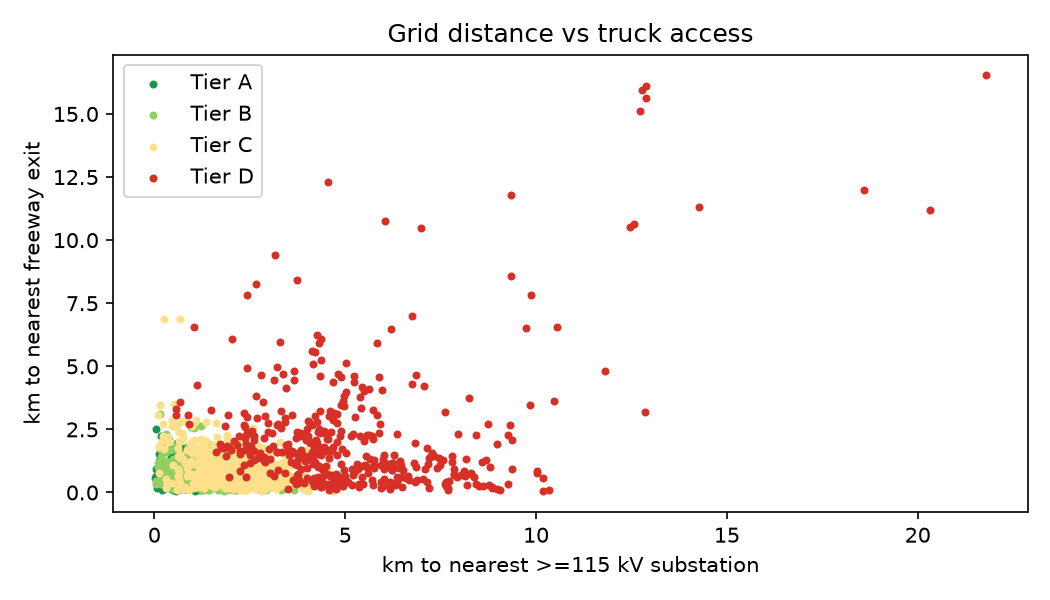
Every one of the top five is within a kilometer of a 230–500 kV substation and under a kilometer from a freeway exit.
How to read the map
- 🟢 Dark green: Tier A, the top 10% of sites. Bigger dots, drawn on top.
- 🟢 Light green: Tier B, the next 25%.
- 🟡 🔴 Yellow / red: Tiers C and D, hidden by default. Tick them in the top-right box.
- 🔷 Dark-blue diamonds: substations at 115 kV or more. Bigger diamond, higher voltage.
- Click any site to see its rank, score, size, the substation it's closest to, its distance to the freeway, nearby power generation, and a link to the satellite view.
How it works
flowchart LR
    subgraph Sources["OpenStreetMap via Overpass API"]
        A1[⚡ substations]
        A2[🏭 power plants]
        A3[🏗️ industrial land]
        A4[🛣️ freeway exits]
    end

    subgraph Pipeline["gridsite (Python)"]
        B[ingest<br/>fetch + cache]
        C[clean<br/>parse voltage + capacity,<br/>drop unusable sites]
        Q{quality gates}
        D[geo<br/>nearest substation<br/>+ nearest exit]
        E[score<br/>0–100 + tiers]
        F[report<br/>map · charts · summary]
    end

    subgraph Outputs
        G[(sites_scored.csv)]
        H[🗺️ live map]
        I[📊 charts]
        J[(summary.json)]
    end

    A1 & A2 & A3 & A4 --> B --> C --> Q
    Q -- pass --> D --> E --> F
    Q -- fail --> X[[stop: publish nothing]]
    F --> G & H & I & J
Every Monday, GitHub Actions re-runs the whole thing on fresh data:
sequenceDiagram
    participant Cron as GitHub Actions (Mon 09:00 UTC)
    participant Tests as pytest (28 tests)
    participant Run as gridsite run
    participant OSM as OpenStreetMap
    participant Site as Live map
    Cron->>Tests: run the tests first
    Tests-->>Cron: pass
    Cron->>Run: python -m gridsite run
    Run->>OSM: 4 layers × 2 regions (retries + backup server)
    OSM-->>Run: raw data
    Run->>Run: clean → quality gates → score → report
    Run->>Site: commit refreshed CSV, map, charts
How a site is scored
Each factor is scaled from 0 to 1, weighted, and added up to a 0–100 score. All weights live in one file, gridsite/config.py, so the whole policy can be changed in one place.
| Factor | Weight | In plain words | Exactly |
|---|---|---|---|
| ⚡ Grid proximity | 40% | How close is the big grid? | Distance to the nearest ≥ 115 kV substation: 1.0 on top of it, falling to 0 at 10 km |
| 🔌 Voltage class | 20% | How big is that substation? | ≥ 345 kV → 1.0 · ≥ 230 kV → 0.8 · ≥ 115 kV → 0.5 |
| 🛣️ Truck access | 25% | Can trucks get in and out easily? | Distance to the nearest freeway exit: 1.0 at the exit, 0 at 5 km |
| 🏭 Local generation | 15% | Is there power being made nearby? | Published plant capacity within 10 miles, log-scaled so 1 GW → 1.0 |
Tiers are percentiles: top 10% → A, next 25% → B, next 35% → C, the rest → D. A tier always means the same share of sites, however the weights are tuned.
pie showData
    title Sites by tier
    "A (top 10%)" : 141
    "B" : 352
    "C" : 481
    "D" : 416
Quality gates
The pipeline refuses to publish if the data looks wrong (checks.py):
- every layer has a minimum row count, so an empty download fails loudly instead of producing an empty map
- no missing coordinates; every point is valid and inside its region
- no duplicate OpenStreetMap ids
- every score is between 0 and 100, and no distance is negative
These gates paid off on the very first real run. Overpass returns only a bounding box for areas in out center bb mode, so every industrial site was silently dropped. The row-count gate stopped the pipeline instead of publishing an empty map. The fix (take the center of the bounding box) now has its own test.
Run it
Requires Python 3.12+. No API keys, no accounts.
git clone https://github.com/aryaMehta26/gridsite.git
cd gridsite
python -m venv .venv && source .venv/bin/activate
pip install -r requirements.txt

python -m pytest -q                                   # 28 tests, no network needed
python -m gridsite run --regions bay_area stockton    # download, score, write docs/ + data/processed/
python -m gridsite run --use-cache                    # reuse downloaded data, only fetch what's missing
open docs/index.html
Want another region? Add a bounding box to REGIONS in config.py.
Project layout
gridsite/
├── gridsite/
│   ├── config.py      # regions, weights, thresholds: the whole scoring policy
│   ├── overpass.py    # Overpass client: POST, retries, backup server
│   ├── ingest.py      # one query per layer -> data/raw/<region>_<layer>.json
│   ├── clean.py       # voltage / capacity parsing, site filtering, area from bbox
│   ├── geo.py         # haversine distance, chunked nearest-neighbor, radius search (numpy only)
│   ├── score.py       # factors, weights, percentile tiers
│   ├── checks.py      # data quality gates
│   ├── report.py      # folium map, matplotlib charts, summary.json
│   └── __main__.py    # command line
├── tests/             # 28 tests on hand-made Overpass fixtures
├── data/processed/    # scored sites, high-voltage substations, summary
├── docs/              # GitHub Pages: live map, charts, header
└── .github/workflows/ # ci.yml (tests on every push) · refresh.yml (weekly rebuild)
Limitations (read before trusting a ranking)
- Being near a substation isn't the same as having capacity at it. A 230 kV substation next door says nothing about whether it has spare headroom. Utilities publish capacity maps that answer that; GridSite doesn't use them yet.
- OpenStreetMap coverage varies. Missing or untagged substations make an area look worse than it is (see Stockton).
- Site size is approximate. It comes from each parcel's bounding box, which overestimates irregular shapes.
- Distances are straight-line, not along roads or power-line corridors.
- Zoning, land price, and availability aren't modeled. This is a first-pass screen, not a siting decision.
What's next
- Add the CAISO interconnection queue to weight sites by planned capacity, not just what's built today
- Join utility capacity data where it's published
- Use real parcel shapes instead of bounding boxes
- Export a CARTO-ready layer
- Add more freight regions: Inland Empire, Port of Oakland drayage, the I-5 corridor
Data & license
Map data © OpenStreetMap contributors, available under the Open Database License (ODbL). Code under the Apache License 2.0.
Built by Arya Mehta.