
Infrastructure MCP Server
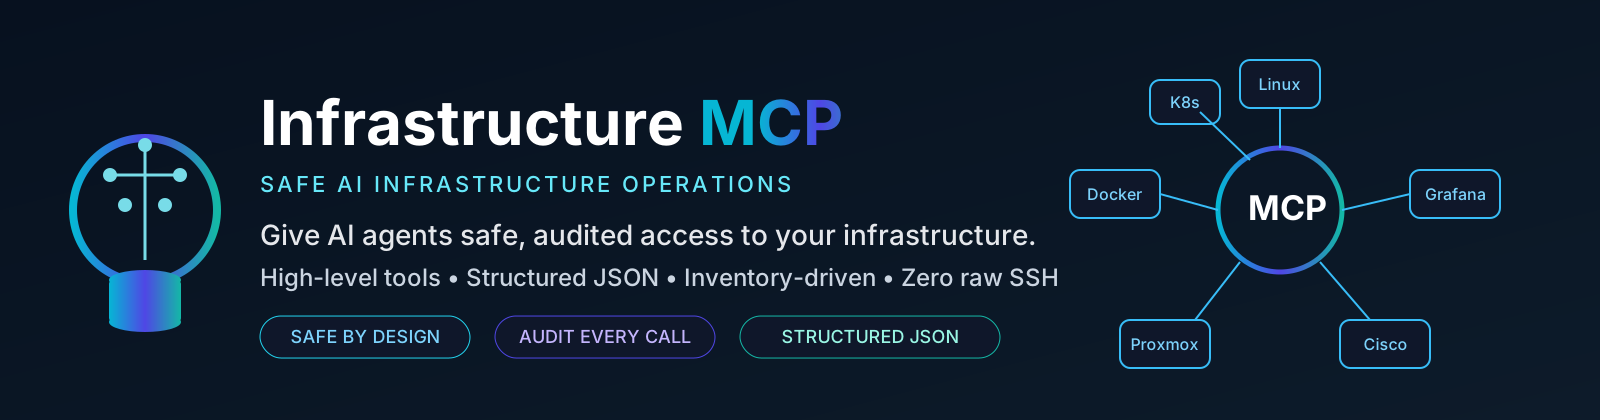
Give Claude Code, Cursor, and other AI agents safe access to your real infrastructure — without giving them raw SSH access.
A self-hosted Model Context Protocol server that exposes high-level, auditable tools (disk_usage(), docker_restart(), grafana_alerts(), ...) instead of execute(command). Every call is inventory-driven, structured, and logged — the agent reasons about infrastructure; this server is the only thing that actually touches it.
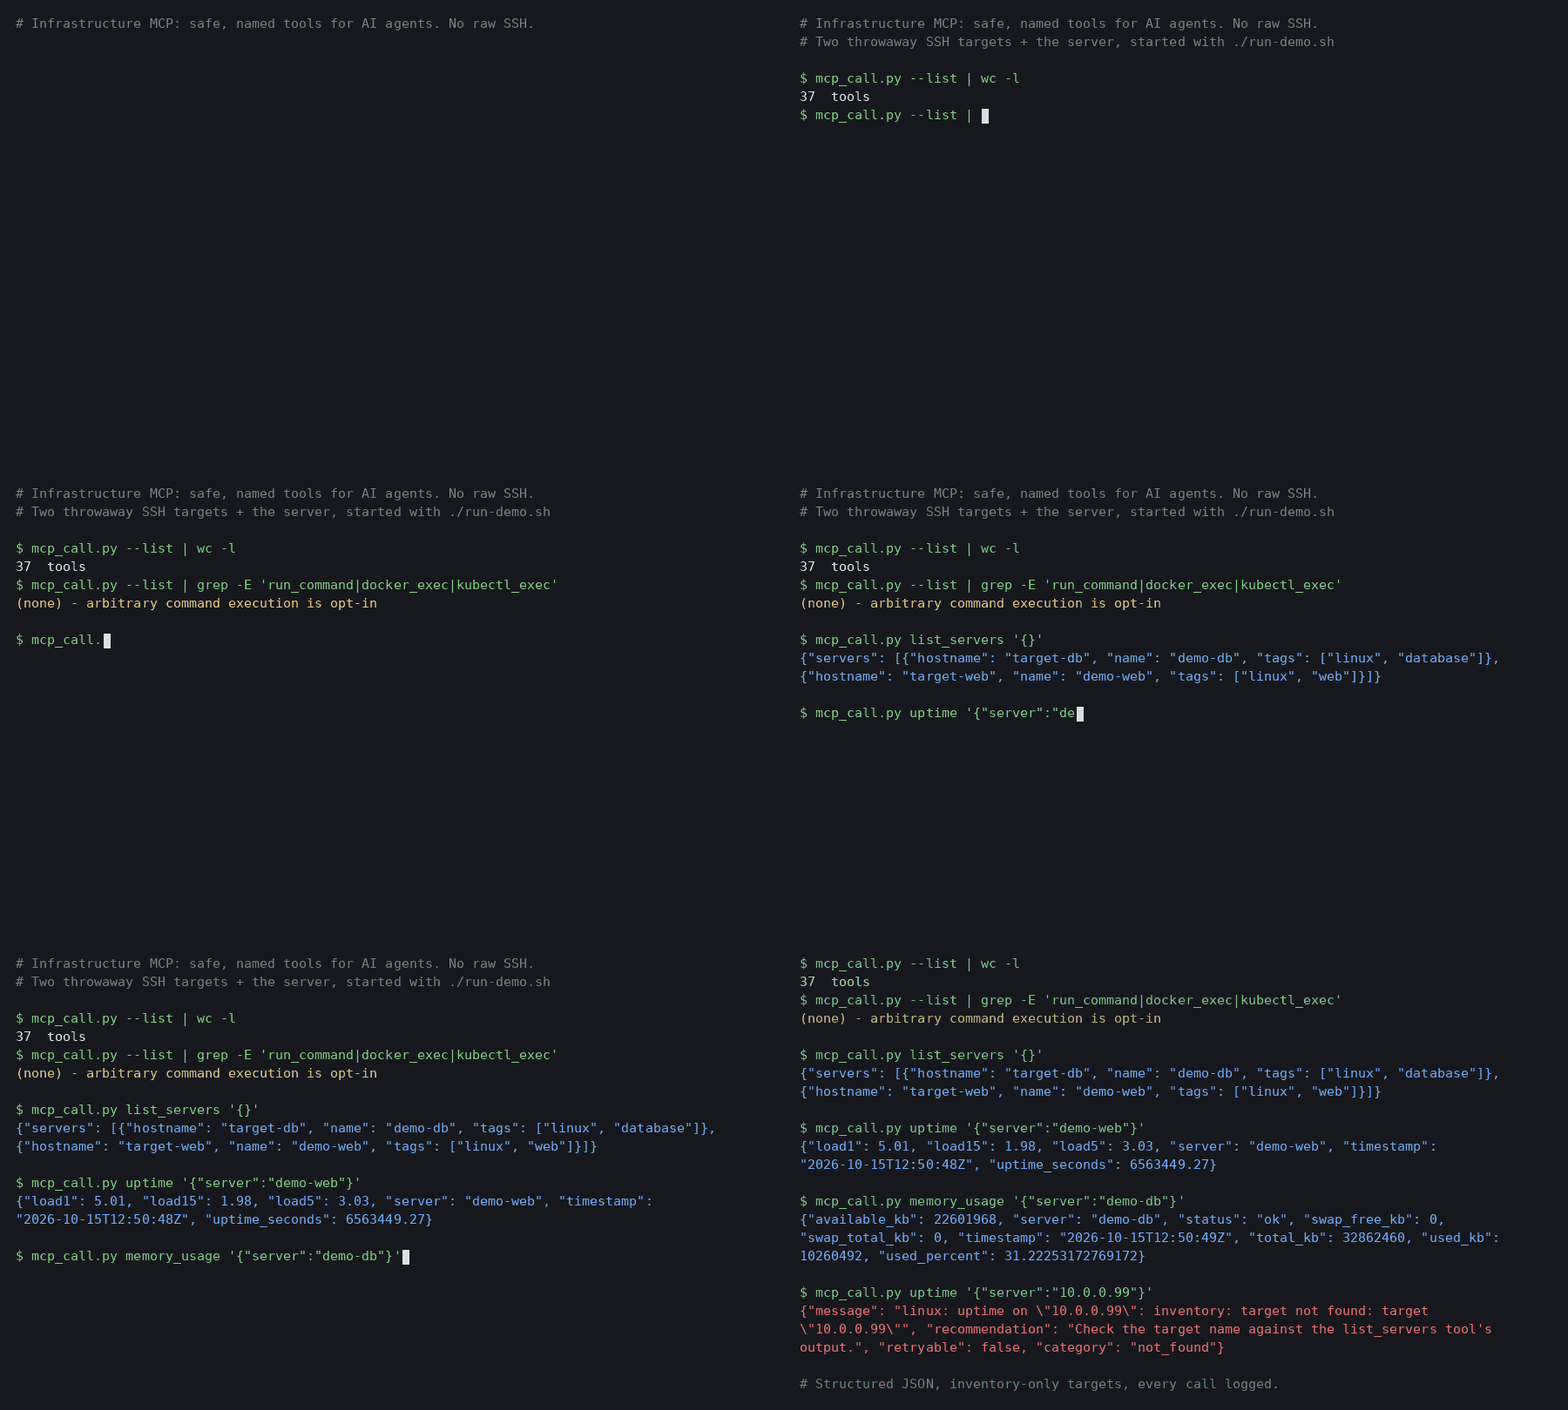
Try it in two minutes, with no real infrastructure:
cd examples/demo && ./run-demo.sh— see the demo guide.
Status: early, actively developed. See Roadmap for what's implemented and what's coming.
Manage: ✓ Linux ✓ Docker ✓ Kubernetes ✓ Proxmox ✓ Grafana ✓ Cisco (MikroTik, UniFi, Prometheus/Loki, Home Assistant, and more are on the Roadmap — not shipped yet.)
Works with: ✓ Claude Code ✓ Cursor ✓ OpenAI Codex ✓ Gemini CLI ✓ Windsurf ✓ Hermes (MCP is an open, client-agnostic protocol — any spec-compliant client works; these are just the ones people actually use it with.)
| Raw SSH access | Infrastructure MCP | |
|---|---|---|
| Audit trail | ❌ | ✅ structured log per call (tool, user, target, duration, result) |
| Input validation | ❌ | ✅ named tools validate every parameter; no shell interpolation |
| Structured output | ❌ free text | ✅ JSON, every response |
| Inventory-aware | ❌ agent picks the host | ✅ targets resolved by name/tag only |
| Blast-radius control | ❌ | ✅ read-only by default, mutations require confirm: true |
| Credential exposure | ❌ agent sees them | ✅ credentials never leave the adapter layer |
Quick Start
Prebuilt binary (Linux and macOS, amd64 and arm64): download the archive for your platform from the latest release, verify it against SHA256SUMS, and unpack it. Or use Docker: docker pull ghcr.io/radumalica/infrastructure-mcp:latest.
From source:
git clone https://github.com/radumalica/infrastructure-mcp.git
cd infrastructure-mcp
go build -o bin/infrastructure-mcp ./cmd/server

cp configs/inventory.example.yaml configs/inventory.yaml   # fill in your own targets
Point your MCP client at the binary — see Connecting an AI Agent for Docker and remote-HTTP setups too:
{
  "mcpServers": {
    "infrastructure": {
      "command": "/path/to/bin/infrastructure-mcp",
      "args": ["-inventory", "/path/to/configs/inventory.yaml"]
    }
  }
}
Example Conversation
You: My archive server feels slow, and I'm seeing errors in Grafana. Can you find out why?

Claude, using Infrastructure MCP:

  1. cpu_usage(server: "archive")                          → 92% used, status: "warning"
  2. docker_ps(server: "archive")                           → prometheus: "Restarting (1) 4 seconds ago"
  3. docker_logs(server: "archive", container: "prometheus") → "panic: too many open files"
  4. grafana_alerts(instance: "main")                        → firing: HighDiskUsage on archive:/

Claude: Root cause found — archive is at 91% disk usage, which is causing Prometheus
to crash-loop on startup ("too many open files" from a corrupted WAL it can't
compact into the remaining space). Free up space on `/` (or expand it), then run:

  docker_restart(server: "archive", container: "prometheus", confirm: true)
Four tool calls, one root cause, zero raw shell access. Every call above is inventory-driven, logged, and returns structured JSON — see Examples for the actual response shapes.
Current Features
Tools implemented and tested against the real MCP protocol so far:
Core (v0.1)
list_servers— list inventory targets, optionally filtered by tagcheck_inventory_health— validate the inventory file: parses, every${VAR}is set, every SSH key/kubeconfig file it references is readableuptime— uptime and load averagesdisk_usage— per-filesystem usage with warning/critical severitymemory_usage— memory utilization with warning/critical severity
Optional compatibility escape hatches: run_command, docker_exec and kubectl_exec execute arbitrary commands on an inventory target, in a container, or in a pod. They are disabled by default and registered only when the server starts with -enable-run-command. Prefer the named tools; enabling them grants connected agents unrestricted command execution.
Linux (v0.2)
failed_services— systemd units in the failed statecpu_usage— aggregate CPU utilization (Proxmox/KVM guest-time aware)reboot_required— pending-reboot detection (marker file + kernel comparison)running_processes— top processes by CPU usagejournal_errors— recent systemd journal entries at error priority+kernel_version— running kernel release
Docker (v0.3)
docker_ps— list containers (running or all)docker_images— list local imagesdocker_stats— point-in-time resource usage snapshotdocker_logs— recent combined stdout/stderr log linesdocker_restart— restart a container (destructive; requiresconfirm: true)docker_exec(opt-in,-enable-run-command) — run a command inside a running container, the container-scoped equivalent ofrun_command
Kubernetes (v0.4)
kubectl_get_pods— list pods, optionally scoped to a namespacekubectl_logs— fetch a pod/container's log lineskubectl_events— recent cluster events, most recent firstkubectl_describe— structured pod summary (spec/status highlights + recent events)kubectl_nodes— node list with readiness, roles, and capacitykubectl_exec(opt-in,-enable-run-command) — run a command inside a pod's container, the pod-scoped equivalent ofrun_command/docker_exec
Grafana (v0.5)
grafana_alerts— currently firing/resolved alert instances from the alerting APIgrafana_dashboards— search dashboards by title text and/or taggrafana_annotations— annotations, optionally scoped to a time range and/or tagsgrafana_query— raw query against one datasource (PromQL/LogQL/SQL/...); response is a datasource-specific passthrough, not normalized
Proxmox (v0.6)
proxmox_nodes— list cluster nodes with status and resource usageproxmox_vms— list QEMU VMs and LXC containers on a nodeproxmox_tasks— recent tasks on a node, most recent firstproxmox_start_vm— start a VM/container (state-changing; requiresconfirm: true)proxmox_stop_vm— force-stop a VM/container (destructive; requiresconfirm: true)proxmox_snapshot— take a VM/container snapshot (state-changing; requiresconfirm: true)
Networking — Cisco (v0.7, partial: MikroTik/UniFi remain on the Roadmap)
cisco_backup— fetch the running configuration, as-iscisco_version— software version, hostname, and uptimecisco_interfaces— interface list with IP address, admin/link status, and line protocolcisco_inventory— hardware components (chassis, modules, PSUs) with PID/VID/serial numbercisco_logs— buffered syslog messages, optionally capped to the most recent N linescisco_backup_diff— fetch the running config and diff it against the last snapshot taken by this tool, flagging config drift
Cross-cutting, since v0.1
audit://recentMCP resource — the most recent mutating tool invocations (docker_restart,proxmox_start_vm/proxmox_stop_vm/proxmox_snapshot), newest first, in-memory only (-audit-history-size, default 200)dry_run: trueon every confirm-gated mutating tool — reports the exact command/API call that would run without acting, taking priority overconfirmeven if both are set- Legacy network device support: Telnet transport, SSH legacy-crypto negotiation, transparent per-target protocol dispatch, SSH public-key auth for routers/switches
- Structured error contract on every tool (
message,recommendation,retryable,category) - Structured per-execution logging (
tool,user,target,duration,result,error) - Host-key verification fail-closed by default, with explicit opt-outs for lab use
- Dual MCP transport: stdio (local subprocess clients) and Streamable HTTP (remote clients), from the same binary — HTTP is fail-closed by default, requiring a bearer token (
MCP_HTTP_TOKEN) unless explicitly opted out for lab use - Docker image (multi-arch, GHCR) + Docker Compose, with a self-check
-healthcheckmode for shell-less containers - CI/CD: PR-gated build/vet/lint/race-tested-CI, automatic semantic versioning + changelog + image publish + Trivy scan on merge to
main— see CI/CD
See Roadmap for what's next.
Table of Contents
- Why
- Goals
- Non-Goals
- Architecture
- Installation
- Configuration
- Connecting an AI Agent
- Agent Skills
- Examples
- Tool Design Philosophy
- Security
- Development
- CI/CD
- Roadmap
- Contributing
- License
- A Note on How This Project Is Built
Why
AI agents are increasingly asked to help operate infrastructure — check disk space, restart a container, look at recent errors. The naive way to enable this is to hand the agent raw SSH/shell access. That's fast to build and dangerous to run: no audit trail, no input validation, no blast-radius control, and every agent has to independently learn how to safely operate every kind of system.
Infrastructure MCP Server is the alternative: a single, self-hosted service that exposes meaningful, structured, inventory-driven tools (disk_usage(), docker_restart(), grafana_alerts()) instead of execute(command). Agents reason about infrastructure; this server is the only thing that actually touches it.
Goals
- Self-hosted
- Production-ready
- Secure by default
- Extensible
- Vendor agnostic
- Infrastructure as Code friendly
- Stateless where possible
- Structured outputs only
- Human-auditable
- Open Source
Non-Goals
The project is not intended to become:
- another SSH wrapper
- another Ansible replacement
- another monitoring system
- another Kubernetes operator
Instead, it provides AI-friendly infrastructure primitives built on top of those things.
Architecture
                 AI Agent
      (Hermes / Claude / Cursor)

                    │
                    │ MCP
                    ▼

        Infrastructure MCP Server

                    │

        ┌───────────┴────────────┐

        │                        │

    Infrastructure APIs      SSH / Telnet Layer

        │                        │

        ▼                        ▼

 Proxmox                  Linux Servers

 Grafana                  Cisco / MikroTik

 Prometheus               UniFi

 Docker                   Home Assistant

 Kubernetes               Storage / Bare Metal
Three layers, wired top-down:
- MCP layer (
mcp/tools/,mcp/prompts/,mcp/resources/) — registers tools with the MCP SDK. Tools call adapters; they never talk to infrastructure directly. - Adapter layer (
internal/linux/,internal/docker/,internal/proxmox/,internal/grafana/, ...) — one isolated package per integration, all implementing a common interface. Authentication (SSH keys, API tokens, kubeconfig) lives inside adapters and is never exposed to AI agents. - Foundation —
internal/inventory/(YAML config, validated, env-var expansion for secrets) andinternal/ssh/internal/telnet(pooled connections to targets, including legacy devices with obsolete crypto or no SSH at all).
Everything is inventory-driven. No IP addresses, hostnames, or credentials appear in tool implementations — targets are resolved by name/tag from the inventory YAML.
Architectural decisions and the reasoning behind them are recorded as ADRs — see docs/adr/.
Technology Stack
| Concern | Choice |
|---|---|
| Language | Go 1.26+ |
| MCP SDK | Official Model Context Protocol Go SDK |
| Configuration | YAML (go-playground/validator) |
| Logging | log/slog (structured, JSON) |
| SSH | golang.org/x/crypto/ssh |
| HTTP | net/http |
| Serialization | encoding/json |
| Testing | Go testing, Testcontainers, Docker Compose |
| CI | GitHub Actions |
Project Structure
infrastructure-mcp/
├── cmd/
│   └── server/            # entry point (stdio MCP transport)
├── internal/
│   ├── inventory/          # YAML config, validation, secret expansion
│   ├── ssh/                 # pooled SSH connectivity
│   ├── telnet/               # legacy device transport
│   ├── remote/                # SSH/Telnet dispatch by target protocol
│   ├── linux/                  # Linux diagnostics adapter
│   ├── docker/                  # Docker CLI-over-SSH adapter
│   ├── toolerr/                  # structured error contract
│   ├── kubernetes/
│   ├── grafana/
│   ├── proxmox/
│   ├── prometheus/, loki/            # planned
│   ├── cisco/
│   ├── mikrotik/, unifi/              # planned
│   └── homeassistant/                  # planned
├── mcp/
│   ├── tools/               # one file per MCP tool
│   ├── prompts/
│   └── resources/
├── configs/                # example inventory
├── docs/
│   ├── adr/                 # architecture decision records
│   ├── TOOL_REFERENCE.md      # every tool's params + example output
│   └── ADDING_AN_ADAPTER.md    # how to add a new integration
├── examples/
│   ├── mcp-client-config/       # ready-to-adapt client JSON snippets
│   ├── inventory-snippets/       # focused single-concept YAML fragments
│   └── sample-tool-outputs/       # example JSON responses
├── scripts/
└── tests/
Installation
Prerequisites
- Go 1.26 or newer (bumped from 1.24 in v0.4 — required by
k8s.io/client-go's current release train) - SSH access (key- or password-based) to the servers/devices you want to manage
- An MCP-capable client (Claude Desktop, Claude Code, Cursor, or any other MCP client)
Build from source
git clone https://github.com/radumalica/infrastructure-mcp.git
cd infrastructure-mcp
go build -o bin/infrastructure-mcp ./cmd/server
Or run via Docker
Pre-built multi-arch images (linux/amd64, linux/arm64) are published to GHCR on every merge to main (see CI/CD):
docker pull ghcr.io/radumalica/infrastructure-mcp:latest
Or with Docker Compose, which wires up the inventory and SSH volume mounts for you — see docker-compose.yaml:
cp configs/inventory.example.yaml inventory.yaml   # fill in your real targets
cp .env.example .env                                # fill in real secrets, never commit
docker compose up -d
Run tests
go build ./...              # build
go vet ./...                # static checks
go test ./... -race -cover  # all tests, race detector, coverage
go test ./internal/linux -run TestName   # a single test
Configuration
The server is entirely inventory-driven — copy the example inventory and fill in your own targets:
cp configs/inventory.example.yaml configs/inventory.yaml
servers:
  archive:
    hostname: 10.0.0.5
    user: hermes
    key: ~/.ssh/archive
    tags:
      - linux
      - ethereum

  pve01:
    hostname: 10.0.0.2
    user: hermes
    proxyjump: jumpbox        # reached only via another inventory target
    tags:
      - proxmox

routers:
  core:
    hostname: 10.0.0.10
    vendor: cisco
    user: admin
    password: ${CORE_ROUTER_PASSWORD}   # resolved from the environment at load time

  legacy-edge:                # no SSH server at all — Telnet only
    hostname: 10.0.0.12
    vendor: cisco
    user: admin
    password: ${LEGACY_EDGE_PASSWORD}
    protocol: telnet

switches:
  ancient-sw:                 # obsolete SSH key exchange/cipher/MAC only
    hostname: 10.0.0.21
    vendor: cisco
    user: admin
    password: ${ANCIENT_SW_PASSWORD}
    legacy_crypto: true

# Every category, including single-instance-feeling ones like Grafana and
# Proxmox, is a map keyed by name — so a second Grafana or a second Proxmox
# cluster is just another key, not a schema change.
grafana:
  main:
    url: https://grafana.lab.local
    token: ${GRAFANA_TOKEN}

proxmox:
  # token is a Proxmox API token in "user@realm!tokenid=uuid" form
  # (Datacenter > Permissions > API Tokens in the PVE UI). Ticket/cookie
  # login is not supported.
  lab:
    url: https://pve.lab.local:8006
    token: ${PROXMOX_TOKEN}
    # insecure_skip_verify: true   # only for a stock Proxmox's self-signed
                                    # cert — lab/dev only, never production

# All auth (client cert, bearer token, exec plugin, ...) lives inside the
# kubeconfig file itself — nothing is inlined into the inventory.
kubernetes:
  home:
    kubeconfig: /etc/infrastructure-mcp/kubeconfig-home
    context: home-admin
Secrets are never written in plaintext. Any ${VAR} in the YAML is resolved from the process environment at load time, and load fails closed if the variable is unset — real credentials are never committed to the repo.
More focused, single-concept inventory fragments (key-authenticated network devices, multi-instance services, ...) live under examples/inventory-snippets/.
Server flags
./bin/infrastructure-mcp \
  -inventory configs/inventory.yaml \
  -known-hosts ~/.ssh/known_hosts \
  -insecure-ignore-host-key=false \
  -transport stdio
| Flag | Default | Description |
|---|---|---|
-inventory |
configs/inventory.yaml |
Path to the inventory YAML file |
-known-hosts |
$HOME/.ssh/known_hosts |
Path used to verify target SSH host keys |
-insecure-ignore-host-key |
false |
Skip host key verification entirely — lab/dev only, never production |
-transport |
stdio |
stdio (local subprocess clients) or http (remote Streamable HTTP clients) |
-http-addr |
:8080 |
Address to listen on when -transport=http |
-healthcheck |
false |
Instead of starting the server, GET -healthcheck-url and exit 0/1 — used as the container HEALTHCHECK |
-allow-anonymous-http |
false |
Allow -transport=http to serve without a bearer token — lab/dev only, every tool becomes reachable to anyone who can reach the port |
-enable-run-command |
false |
Register the unrestricted run_command, docker_exec and kubectl_exec escape hatches — high risk, prefer named tools |
-backup-dir |
configs/backups |
Directory cisco_backup_diff persists its per-device config snapshots in (created on first use) |
-audit-history-size |
200 |
Number of recent mutating tool invocations retained in-memory and exposed via the audit://recent resource |
Host key verification is fail-closed by default: an unrecognized target's c